
We had a great time last month at the annual meeting of the North American Cartographic Information Society, talking with old and new friends about a shared love of maps. We also had a record number of team members giving presentations, both about our Stamen work and about some passion projects. We wrote a previous blog post here about our plans for the conference, and now that the event is over we can look back on some of our favorite moments.
Overall I was struck by how friendly everyone was at NACIS. Maybe it’s the midwestern vibe, maybe it’s that there were so many university people there, maybe it’s that everyone was super psyched to see one another after a couple of years of lockdown; whatever it was, “NACIS is the nicest” certainly rang true for me as a first time visitor and speaker.
And for sheer unabashed geo-nerdery, it’s hard to beat Geodweeb Geopardy, “where we separate the nerds from the dweebs”: “I’ll take Airport in Common for $400, Dennis,” and then you have to guess which cities share airports around the world. Astounding.
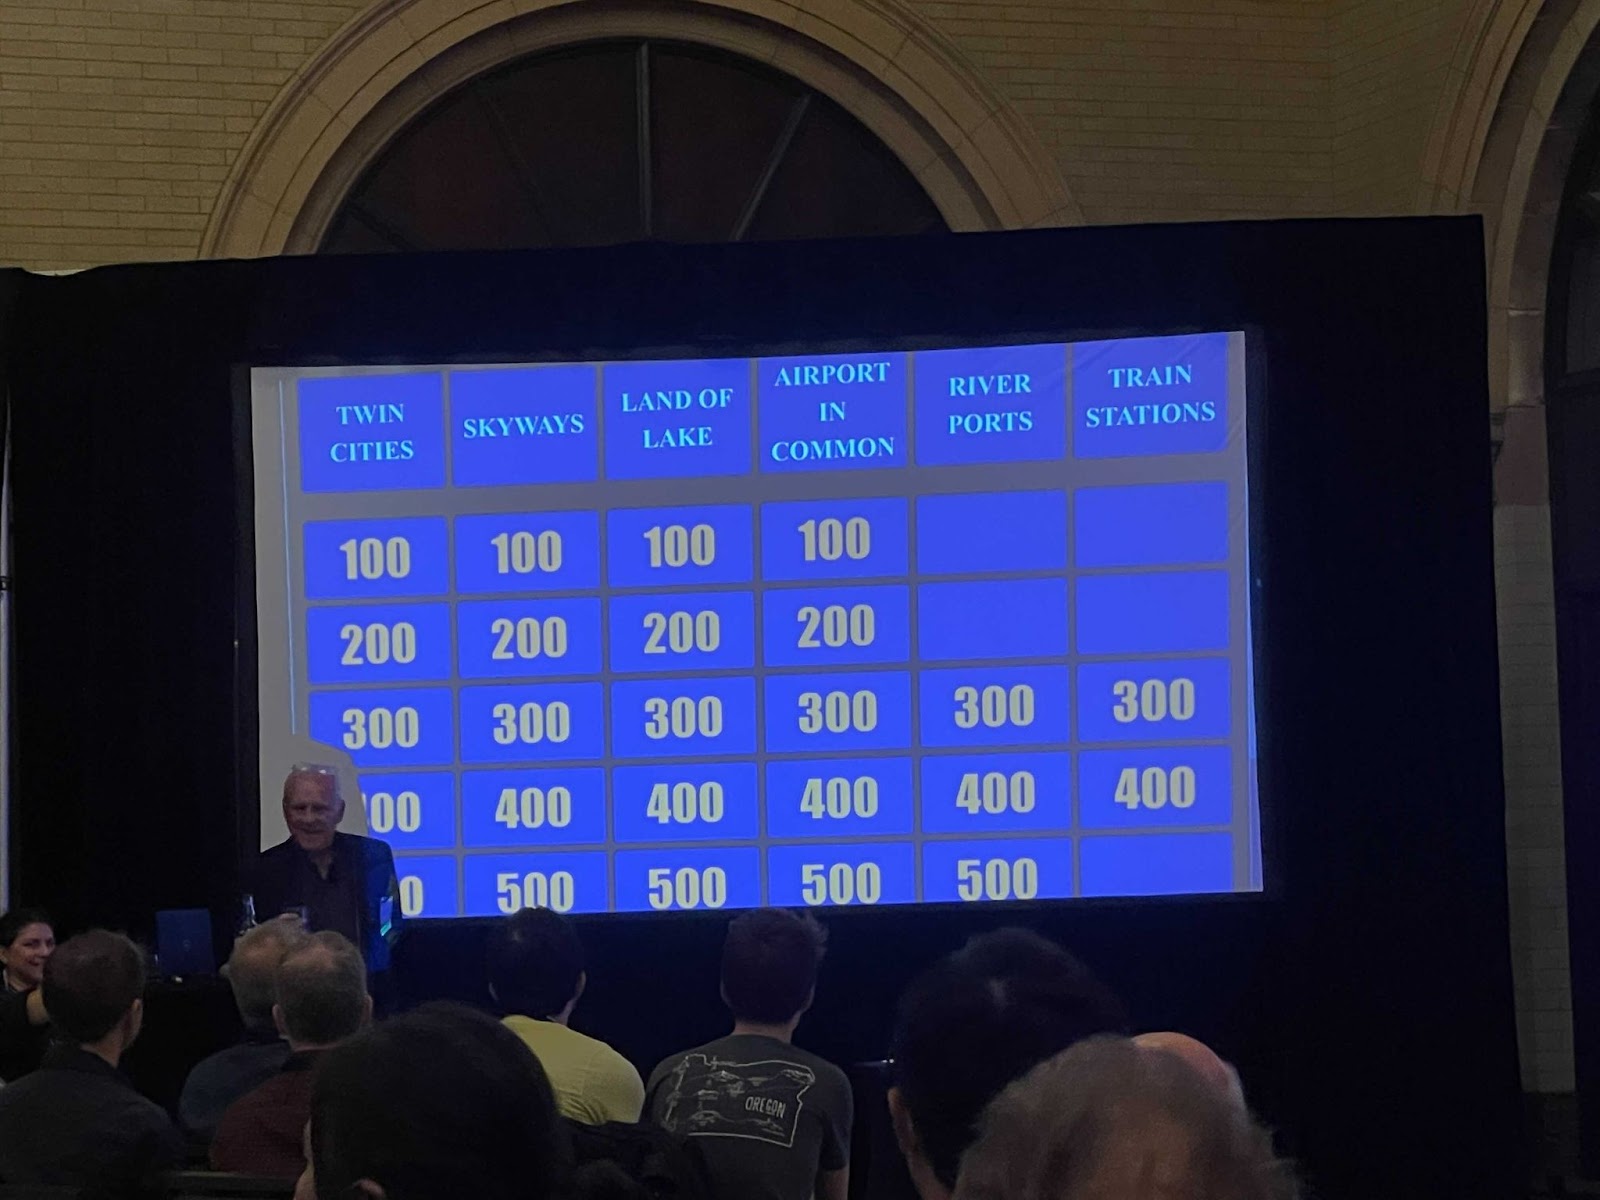
Geodweeb Geopardy is just one of many you-had-to-be-there moments, but if you’re interested in the official content of the conference program, you don’t have to miss out: all the recorded presentations are now posted on YouTube for everyone to view!
Let’s look at the five Stamen presentations we were excited to share:
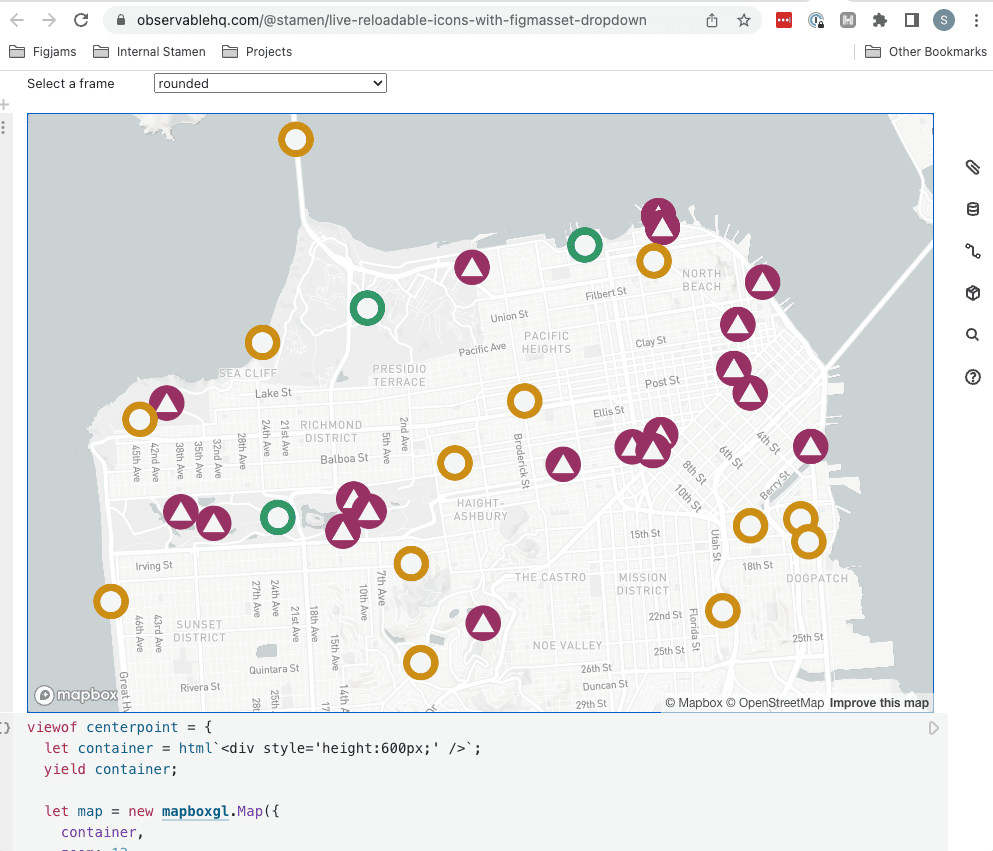
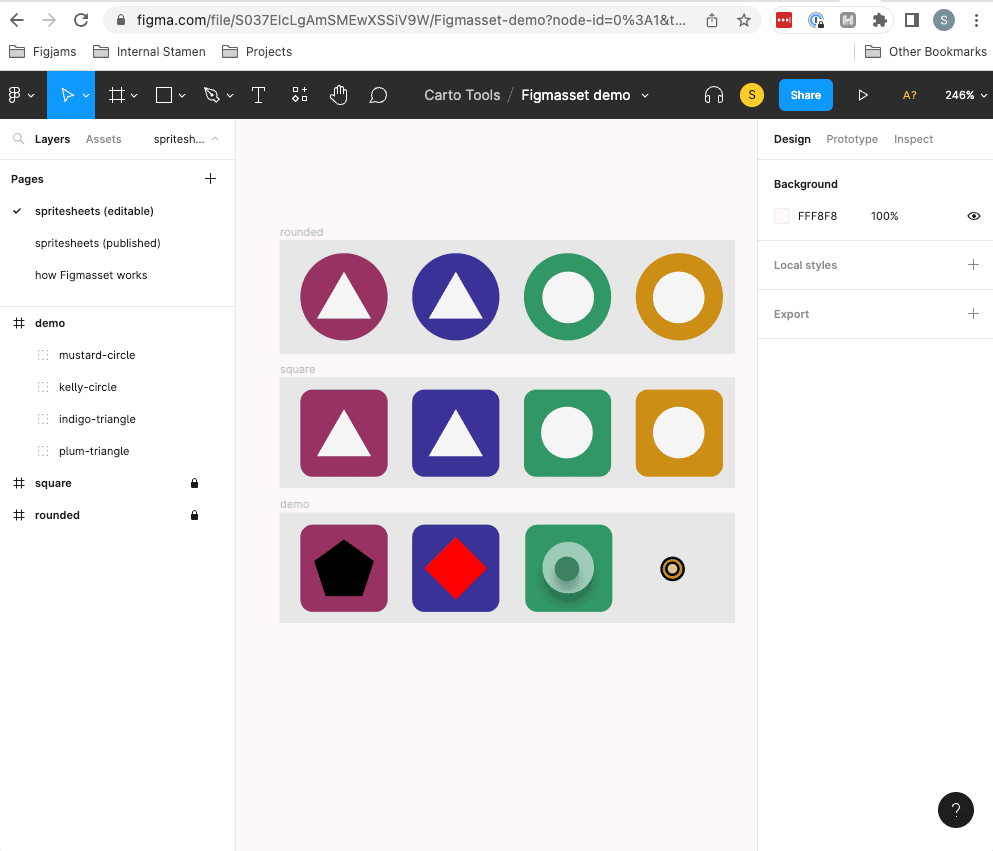
First of all, on Practical Cartography Day to open up the conference, Kelsey Taylor and Stephanie May gave a presentation about one of our essential in-house design tools called “Figmasset”. This tool allows us to design icons in Figma, view them directly on a map, and export them as spritesheets that are immediately useable on any Mapbox or MapLibre map.
This short presentation included not one but two live demos, and we were pleasantly surprised that it all went off without a hitch, and we even got some interactive audience participation in our demonstration map stylesheets! You can watch the presentation on YouTube here: Figmasset: A Missing Map Tool – Stephanie May & Kelsey Taylor and follow along with the slide deck right here: Figmasset: A Missing Map Tool.
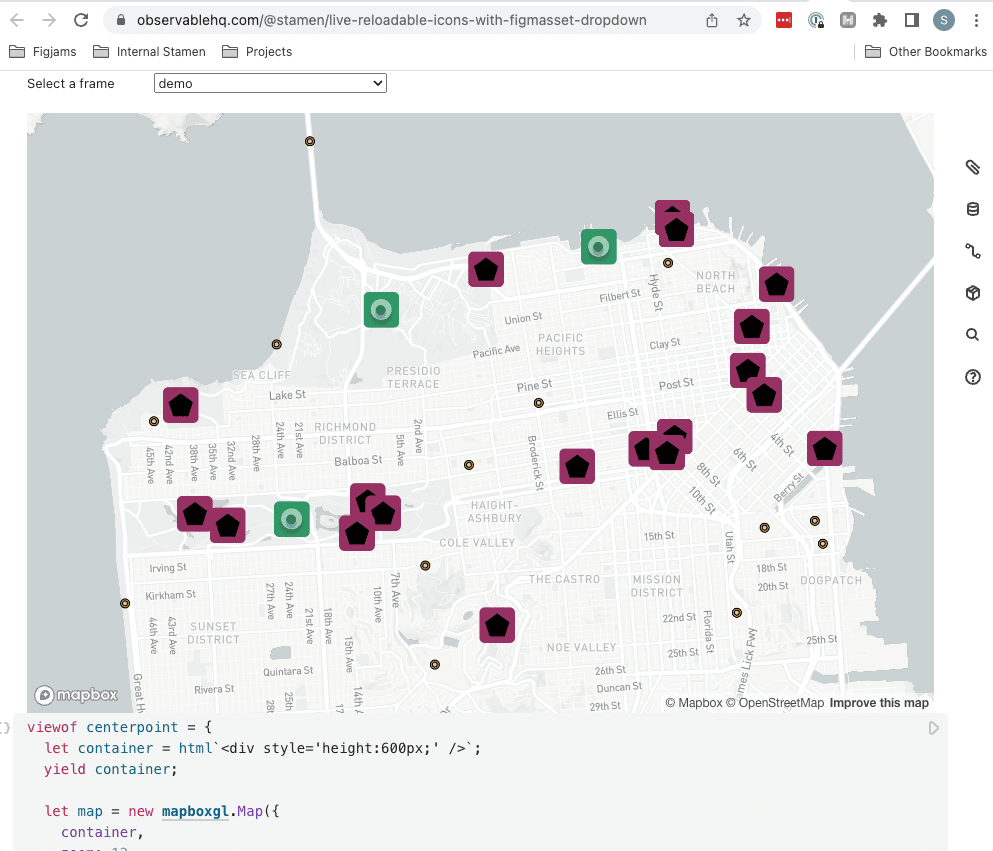
You can also try your hand at improving the demo icons in Figma and seeing them re-render on the demo map in Observable. Crowdsourcing to get to beautiful icons is tough, as you can see below. Think you can fix these icons so they look right with the map? We’ll keep these links live through December. Send us your attempts, or tag us on social media when you do!
For all of our presentations, we enjoyed following along with the parallel discussions happening on twitter and on the NACIS Slack:

On the first evening of the conference, we hosted a happy hour at Crooked Pint Alehouse with over 70 attendees. Sorry, all the photos are blurry (you’ll thank us for not sharing them!) but you’ll have to take our word for it that a great time was had by all.
Then on Thursday came the bulk of Stamen’s presentations:
We kicked off Thursday with Ross Thorn’s talk: So You Wanna Start a Mapping Podcast, where Ross dug deep into the details of how Stamen started our “Pollinate” podcast (available wherever you get your podcasts!) and also revealed that he’s definitely one of the cartographers that knows where the bodies are buried:
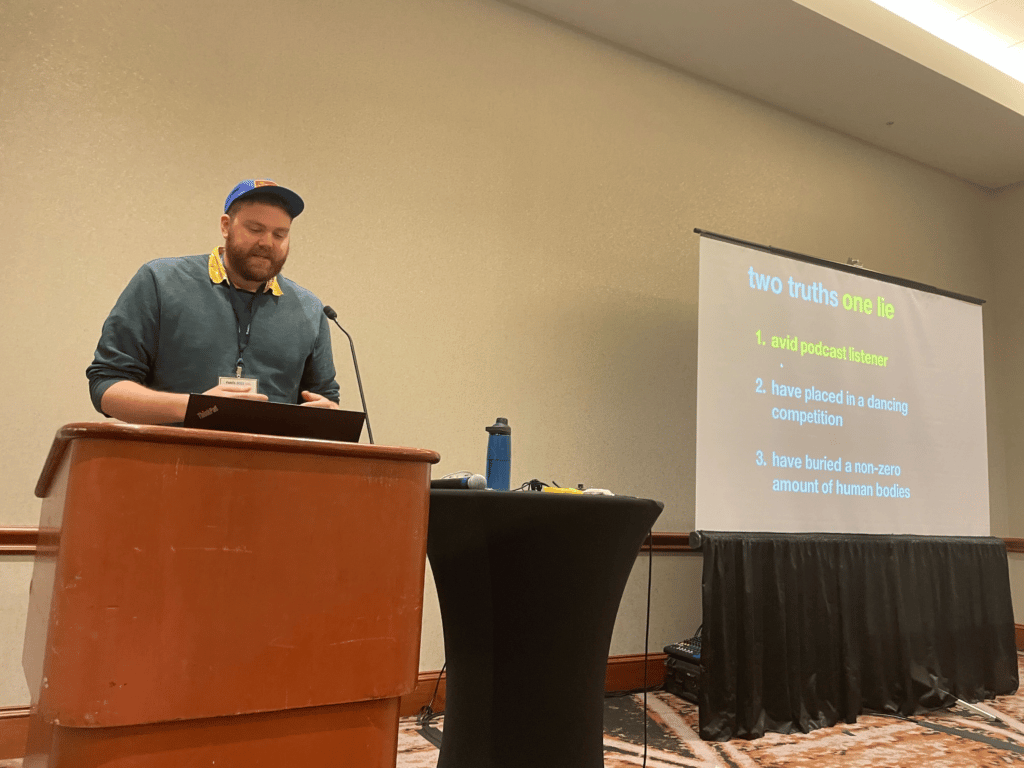
When you listen to Ross’s talk on Youtube, make sure you put on your headphones for the full ASMR effect:

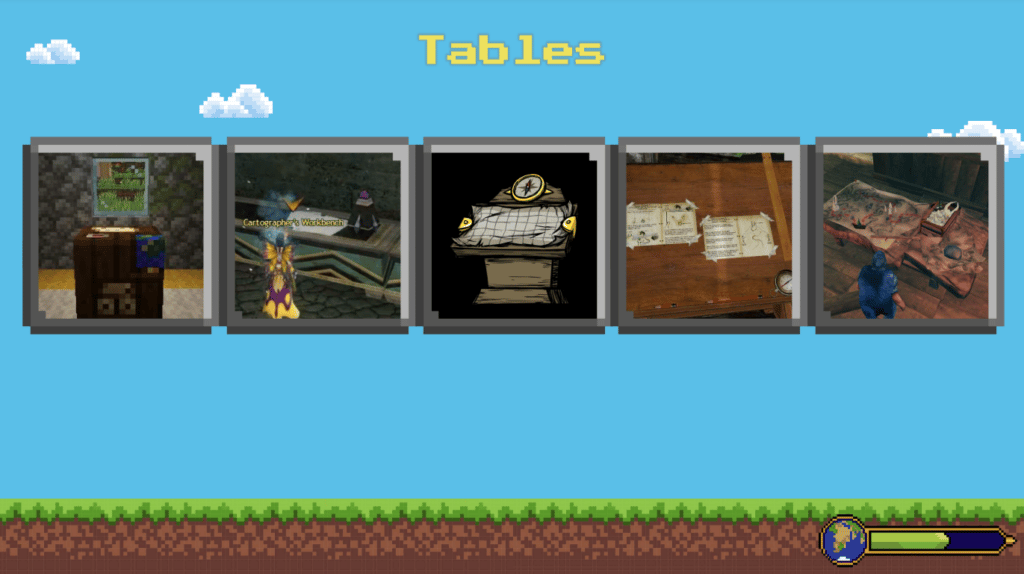
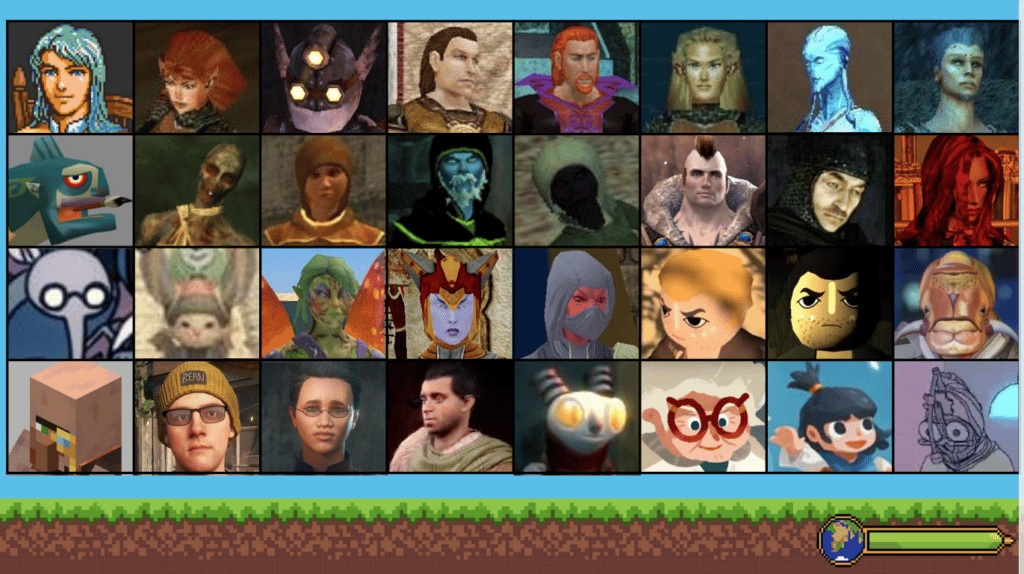
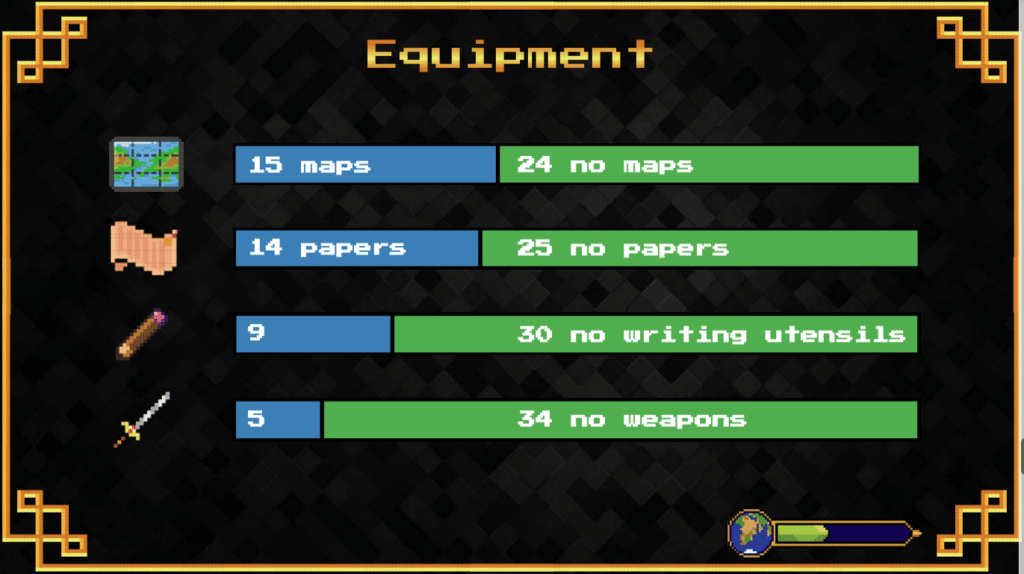
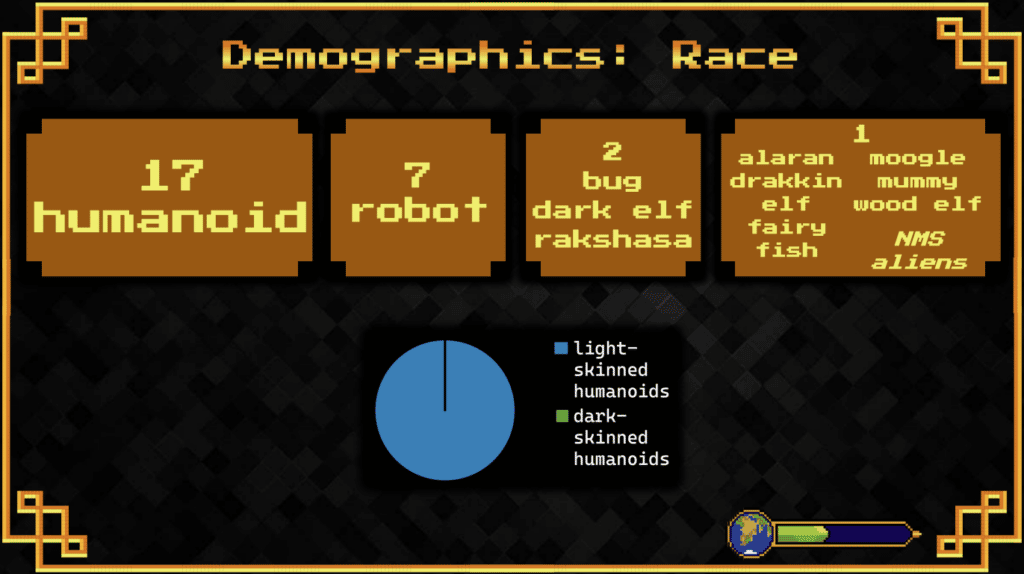
Also Thursday morning was Kate Leroux’s talk “I Want to Be a Cartographer When I Grow Up!”
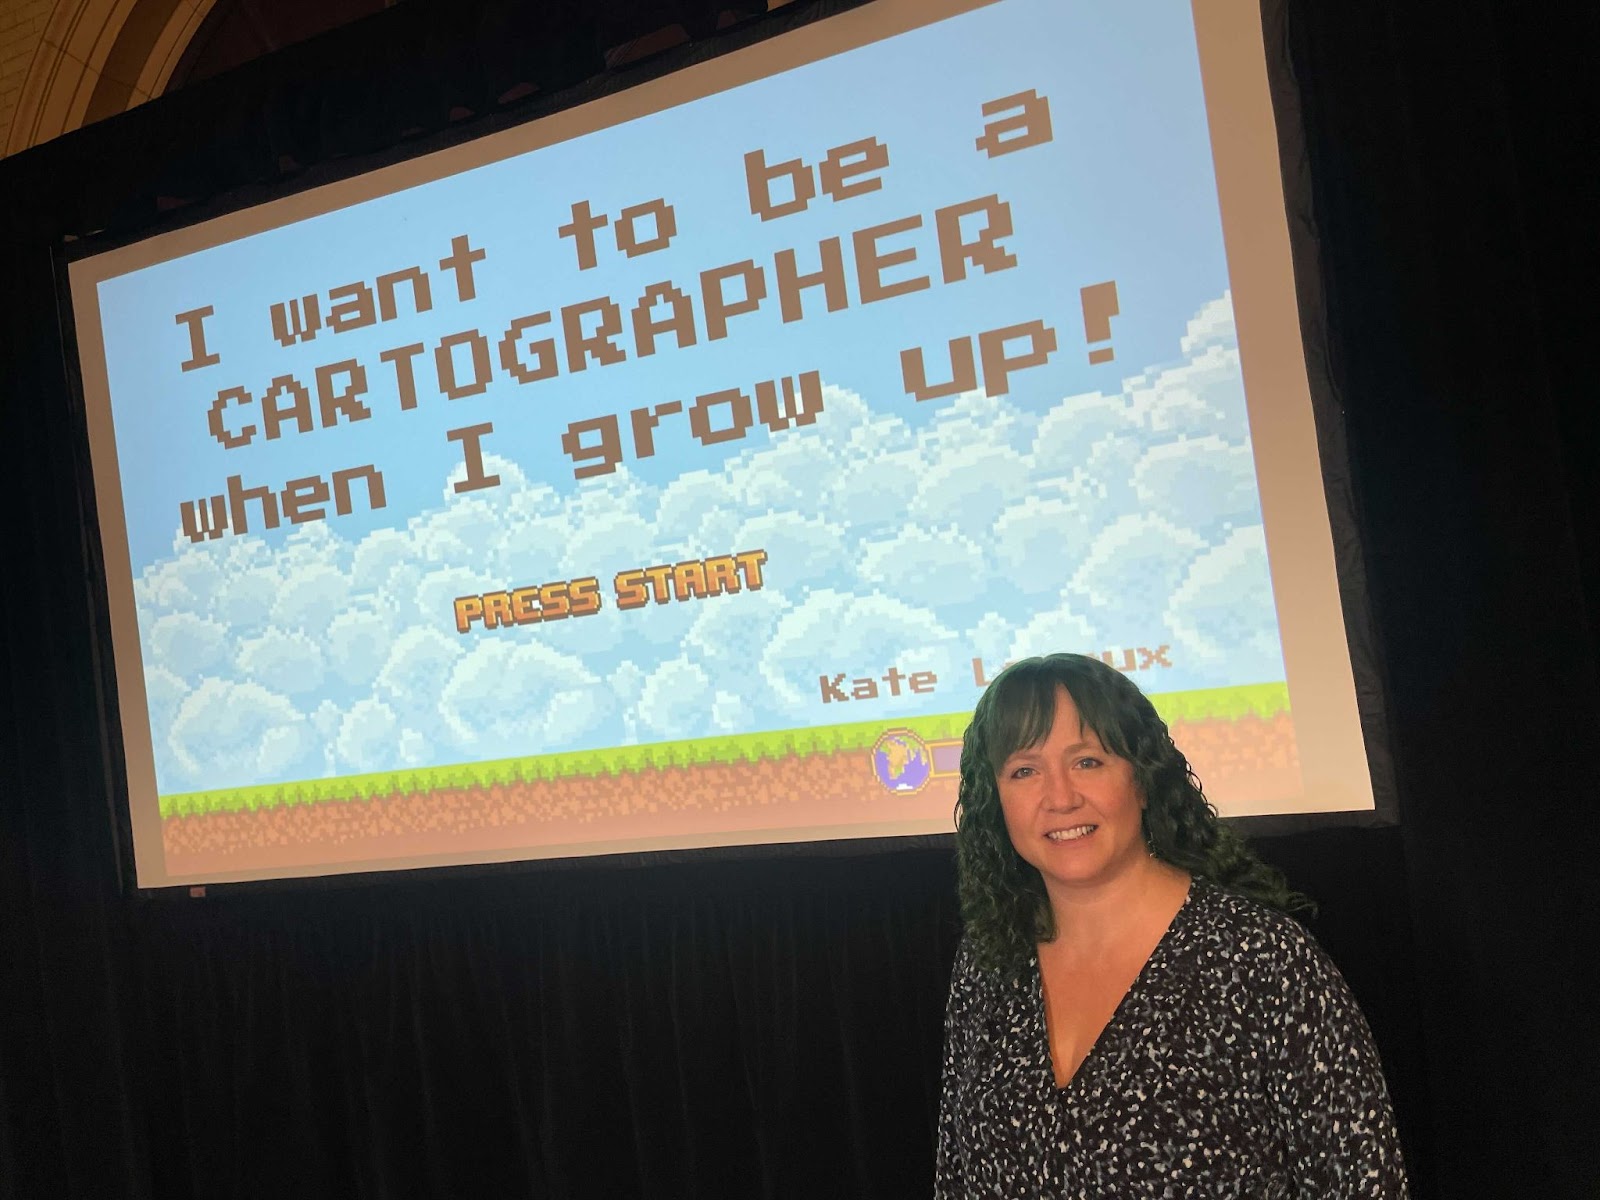
Kate’s exhaustive research includes some fascinating charts and and screenshots showing the wide diversity (or sometimes lack of diversity) in how cartographers have been portrayed in video games over the years. In addition to the YouTube link above, here is a direct link to Kate’s slide deck.
Then in the afternoon Stephanie May’s presentation “What is Vector Tile Cartography?” was packed with deep thoughts, Wizard of Oz metaphors, and just a sprinkling of “geospatial snark” as Stephanie tried to untangle the many strands that intertwine in the work we specialize in at Stamen: this thing we call “Vector Tile Cartography”.
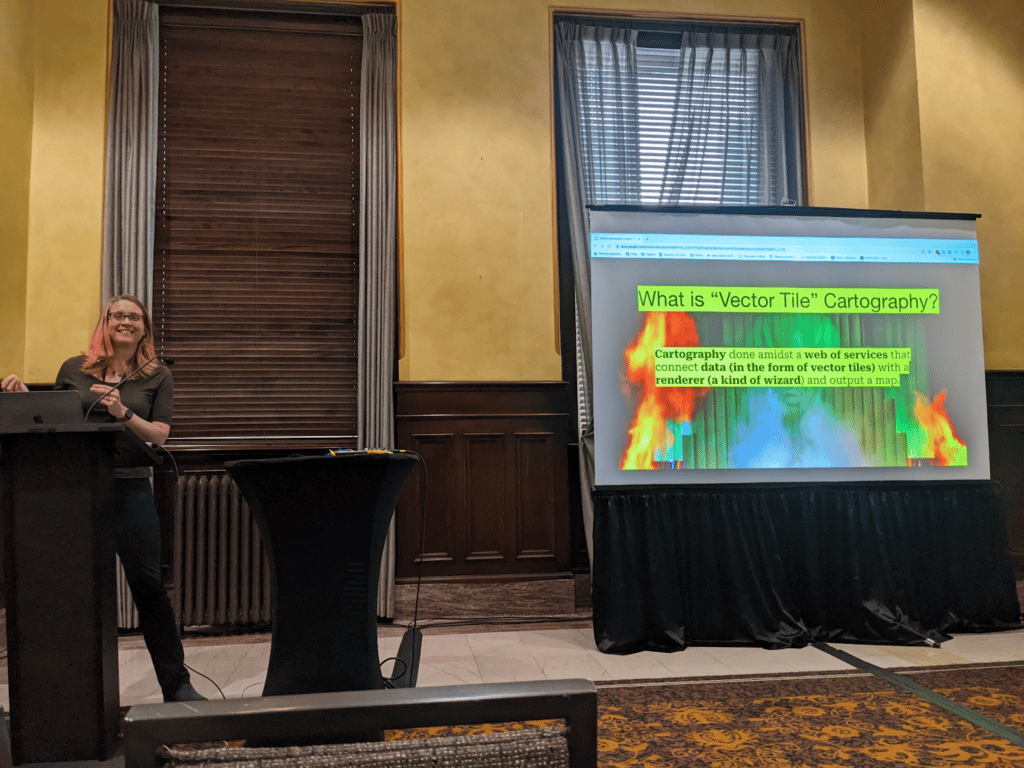
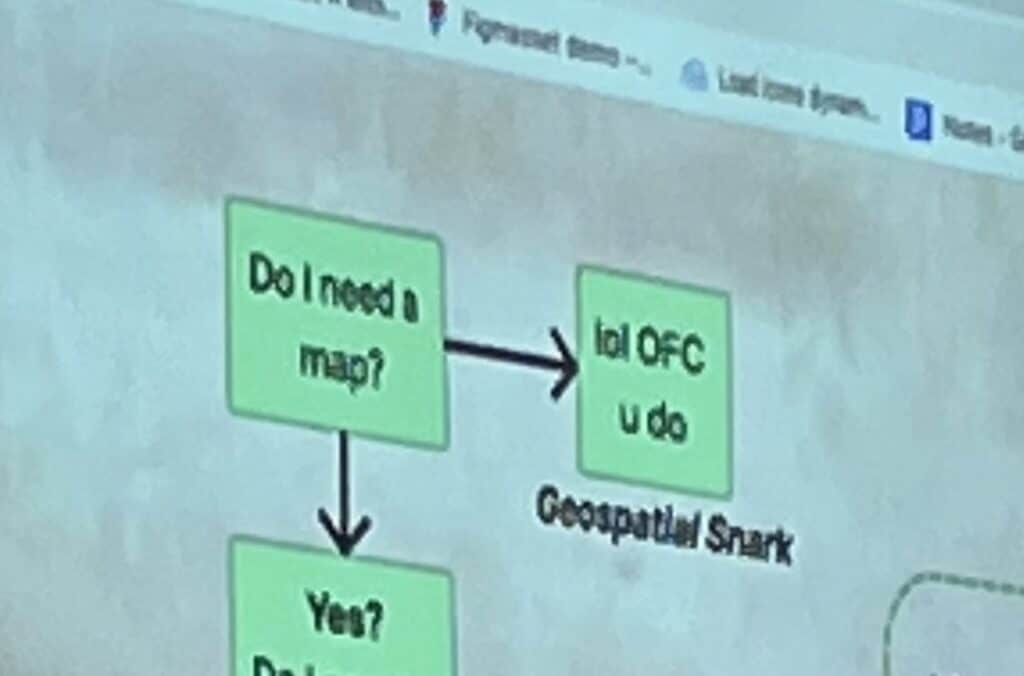
You can read Stephanie’s slide deck here: What is Vector Tile Cartography? Stephanie May. In particular here was a lot of love for the “forking paths of the yellow brick road” slide:
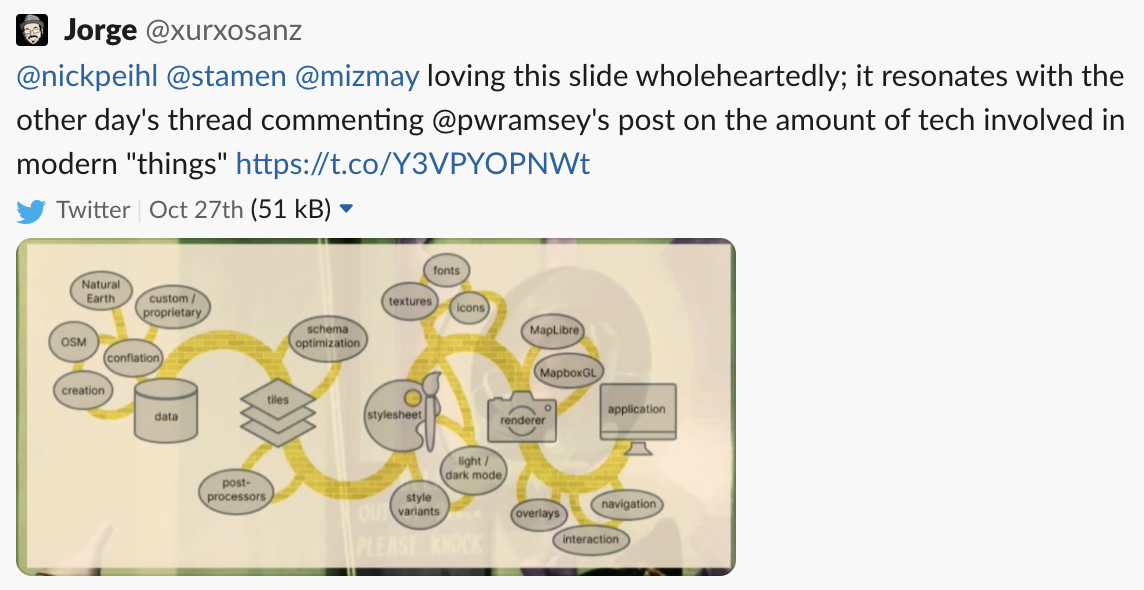
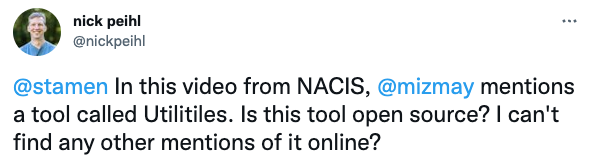
We appreciate that a few people were tantalized by some of the not-yet-public Stamen cartography tools Stephanie teased in the presentation, such as “utilitiles”. Don’t worry, we’ll be posting more about all these tools in due time.
We’ll be publishing a blog post about Vector Tile Cartography in the coming weeks, and in the meantime we encourage you to listen to Alan McConchie’s recent interview on the MapScaping Podcast about “Full Stack Cartography” which discusses many of the same concepts from a slightly different angle.
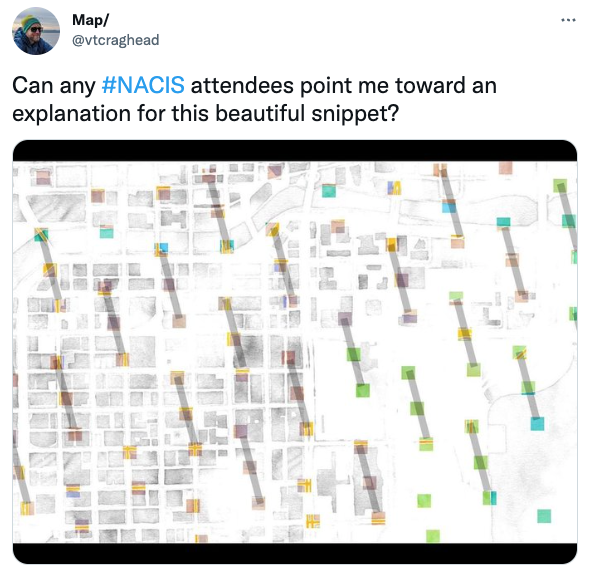
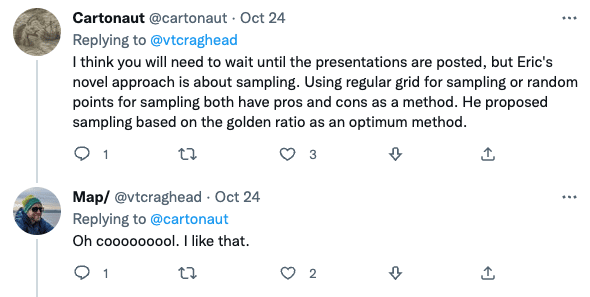
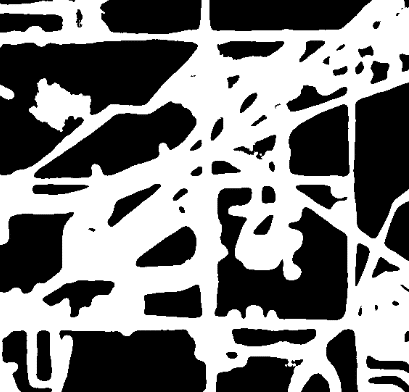
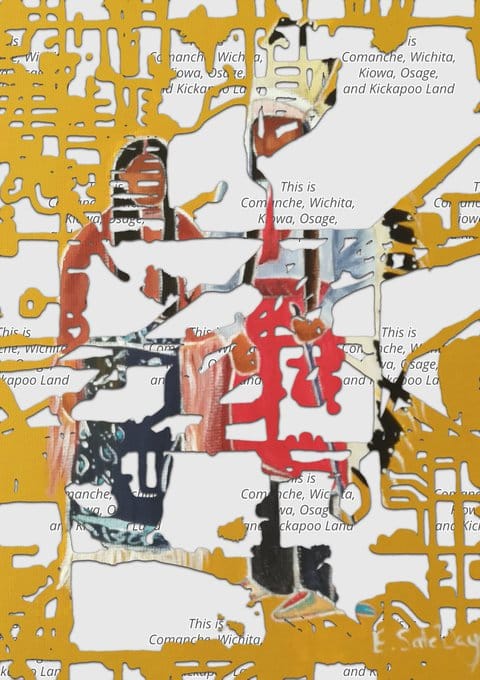
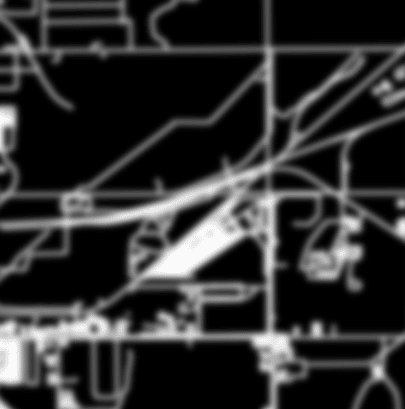
And finally, here’s the video for my presentation on “Cartography & the Golden Ratio“.
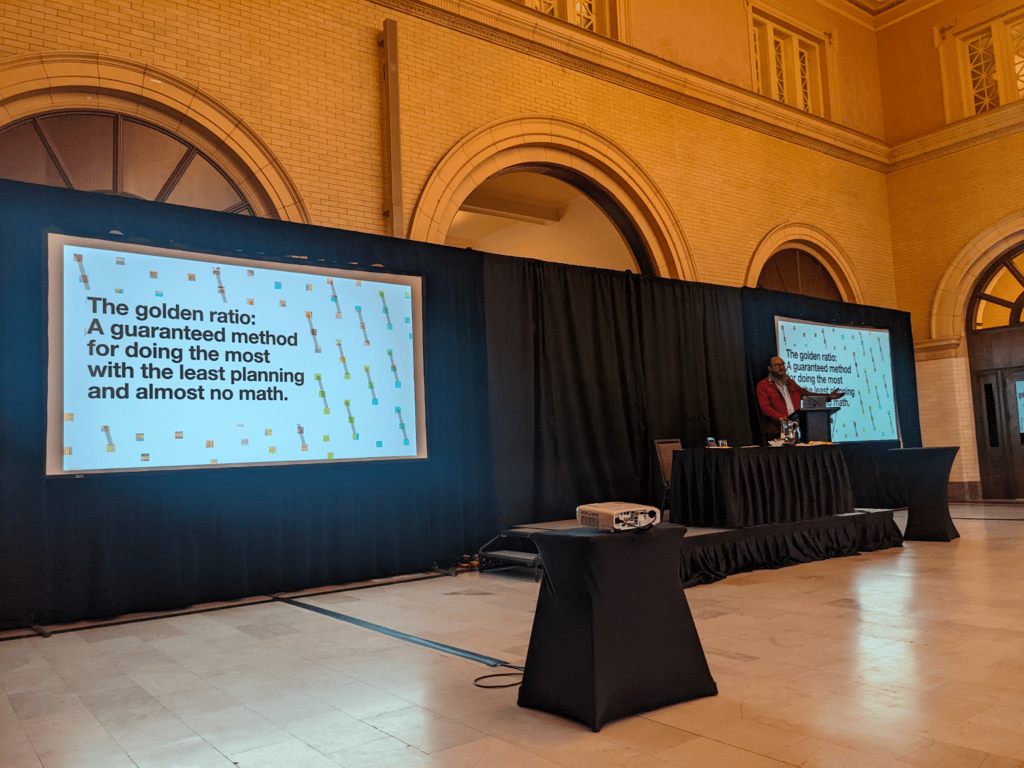
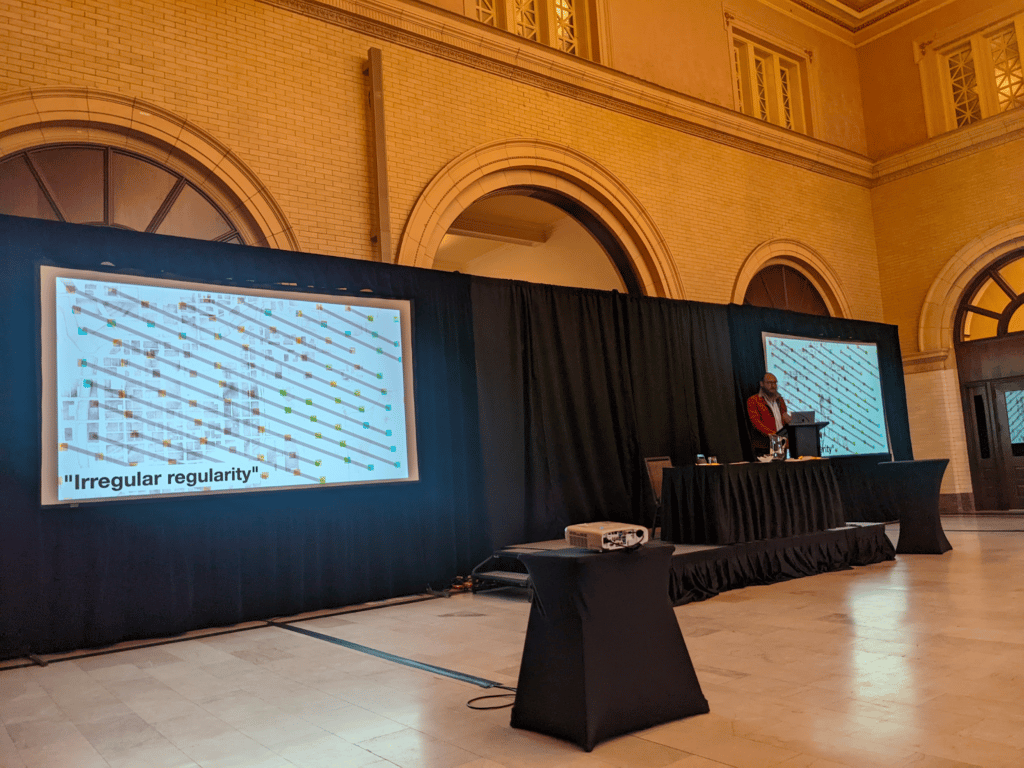
You can view the slides here, and learn more in a blog post we just published yesterday: “Golden Ratio & Cartography; a talk at NACIS 2022”
Some of those slides baffled the audience, but in a good way we hope, leading to more follow-up discussion on twitter:
Oh, and if you missed the annual NACIS “map quilt”, our own Ross Thorn designed a piece of it this year, which you can see behind these scenes here:
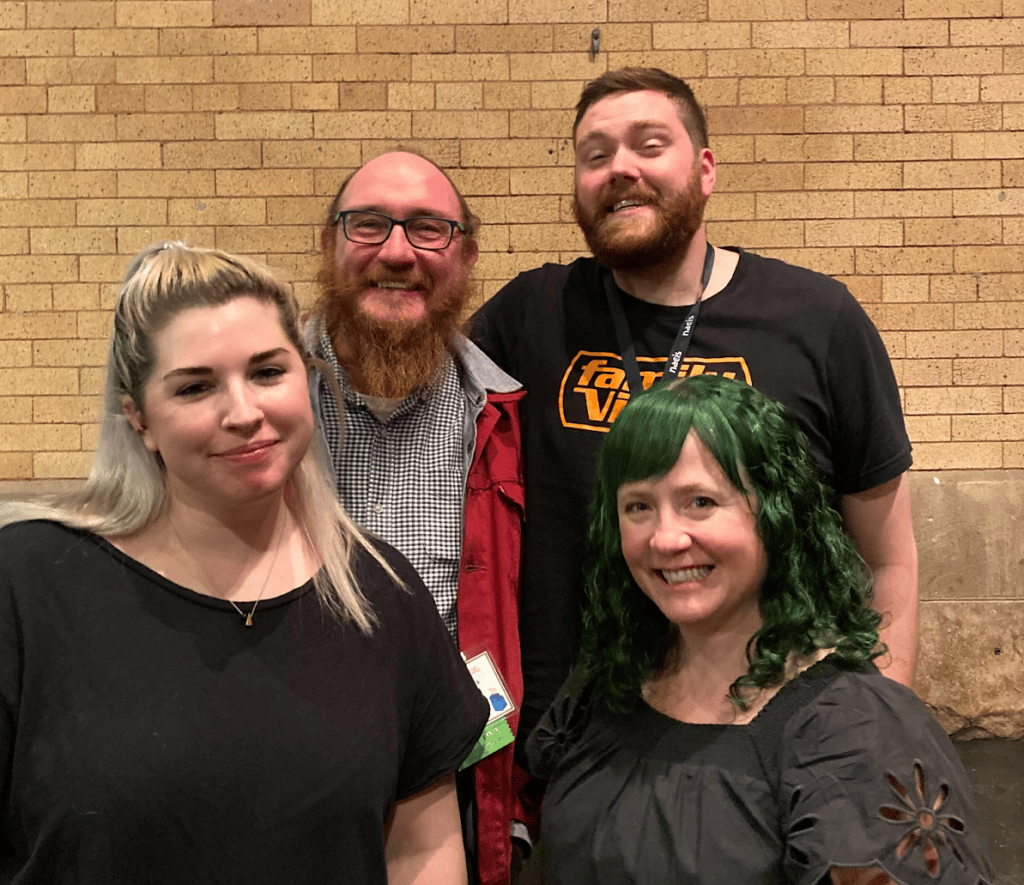
NACIS was also a rare chance for some of our distributed team to get some much-needed facetime. Look at these smiling faces!
Thanks again to everyone who came out to our presentations, and big thanks to the NACIS organizers for putting on a wonderful conference. We look forward to seeing you all again next year!