
In recent years, Stamen has developed and maintained a suite of cartography tools on Github, which include open source code for generating map styles and utilities for working with cartographic data. These tools leverage existing needs and software to make cartographic work faster, easier, and more collaborative.
Our tooling suite improves workflows for all parts of the web cartography process, including data exploration, style building, icon creation, in-situ previews, and style analysis. These tools are available to the public on Github and we welcome community contributions, feedback, and feature requests.
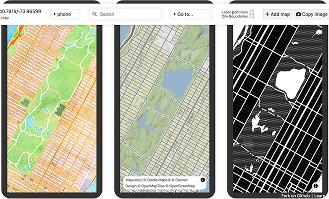
Maperture ➤
Maperture is an interactive map viewer that allows easy side-by-side viewing of up to six map styles at once. Features include swipe mode, Github branch comparisons, label collision views, and easy data investigation within the interface. Maperture supports several renderers, including Maplibre GL, Mapbox GL, MapTiler SDK, and Leaflet.
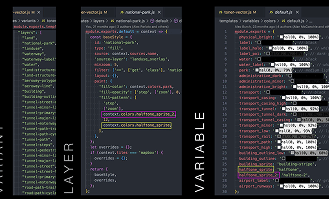
Map GL Style Build ➤
Map GL Style Build is a build system for Maplibre GL and Mapbox GL styles that enables modular, maintainable map styling through template-based stylesheet development. Map GL Style Build allows for easier collaboration and scalability from one to a complex suite of related map styles.
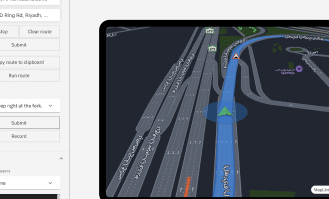
Route simulator ➤
The route simulator is a tool for simulating turn-by-turn navigation using your custom Maplibre GL or Mapbox GL styles in situ. For the most accurate style preview possible during development, the route simulator allows you to customize camera behavior, add map and interface icons from Figma, and restyle the route line to work best with your app interface.
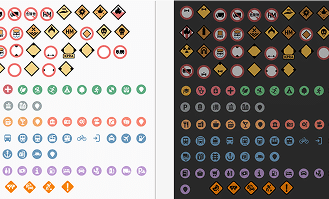
Figmasset ➤
Figmasset facilitates bulk-loading assets from Figma into a JavaScript application. Designers can iterate on icons without needing developers to redeploy assets whenever an update is available. Our Figmasset workflows also allow the team to manage design assets in Figma, then create, host, and add custom spritesheets to map stylesheets within a few clicks.
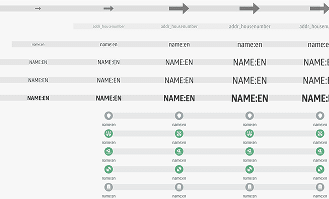
Chartographer ➤
Chartographer is a visualization tool that breaks down different stylesheet properties by layer and zoom level for easy analysis and debugging. Think of it as a cross-section of your map, where you can easily see how individual layers are rendered across all geographic scales.