A collection of all blog posts by Stamen Design.

blog/Stamen Design

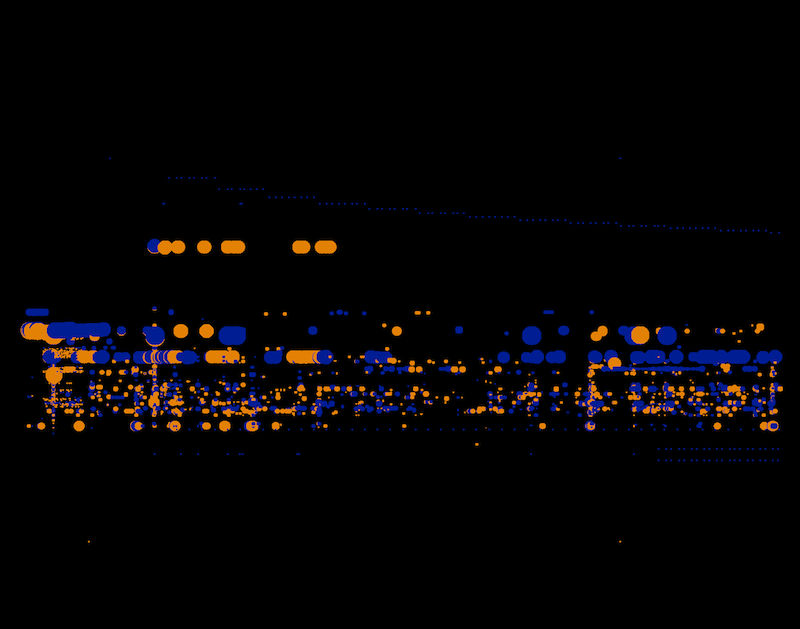
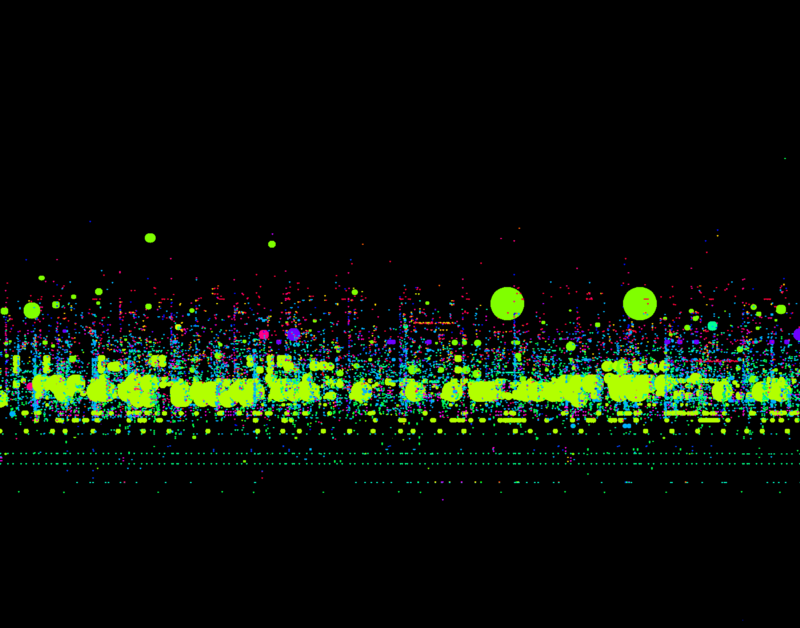
Visualizing a day of financial transactions on NASDAQ part 2

Stamen Design | 07.25.12

This is a followup to yesterday’s post on the visualization of a day’s worth of trading data on the NASDAQ stock exchange. We’ve taken another look at the same dataset a bit more closely. In the examples that follow, each of which represents a single minute of trading, the image on the left uses a...

Visualizing a day of financial transactions on NASDAQ

Stamen Design | 07.24.12

Earlier this year Zach Watson and I spent some time visualizing financial data. It’s time to make that work public. The following images represent visualization of buy/sell data during a single day of NASDAQ trades. We mapped a small subset of the variables for each transaction: time of the transaction, to the second whether it...

Watercolor New York, 20×200

Stamen Design | 07.18.12

We’re pleased to announce our second collaboration with Jen Bekman’s 20×200, releasing gorgeous prints of New York City today, and London shortly. There will be more cities coming over the next few months, so please stay tuned! It was a nice sidestep to work with the maps at high resolution, and on paper. We also...

Detailed Toner v2 (2012) change notes

Stamen Design | 07.16.12

Eric gave a general overview of the changes we rolled out for Toner v2 in this post and this post. In my post I dig into the technical details. But first, pictures! Visual changelog for Toner 2012: Toner v2 (2012 and 2011) uses High Road for more sophisticated roads and tucks San Francisco’s punky park...

Toner V2 is live, and there are historical versions

Stamen Design | 07.03.12

We’ve got some new additions to Toner, the black and white style that Geraldine started and that Nathaniel and Mike have been gradually improving this year. There are some fairly significant changes to the cartography stack all the way through, which you can read about in detail at the project’s visual changelog on GitHub. And...

Just the streets, ma’am.

Stamen Design | 07.03.12

The first thing I thought after we hung a copy of London’s Kerning, a printed map showing only the street names in London, in the studio, was: I want one of those for the rest of the world. “How hard can it be to just(people here love that) show the streets?” As part of the...

Stamen in Icon 109

Stamen Design | 07.02.12

We’re the cover story (!) of this month’s Icon Magazine, featured alongside my longtime heroes at the Center for Land Use Interpretation as part of the maps issue. Ari Messer did a terrific job on the interview, and R.C. Rivera spent an afternoon photographing our plant- and map-filled studio with some lovely results. Unfortunately Shawn...

Trees, Cabs & Crime in the Venice Biennale

Stamen Design | 06.26.12

This post was originally published on stamen.com by Shawn Allen. We’re proud to announce that Trees, Cabs and Crime will be on display in the U.S. Pavilion at the 13th Venice Architecture Biennale this fall. The Institute for Urban Design was chosen by the U.S. Department of State’s Bureau of Education and Cultural Affairs to...

Kelso at MIT for 2012 Knight News Challenge Winners

Stamen Design | 06.25.12

Nathaniel showcased nearly two years of City Tracking in Boston last Monday at the MIT/Knight Story and the Algorithm conference. You can read about this years’ winners here, as well about the changing nature of the grant: shorter cycles, more opportunities to apply, that kind of thing. It’s worth a look. The City Tracking project...

Creepy Maps: Quarantine Your City

Stamen Design | 06.21.12

Earlier this year we worked with Warner Bros. to create an interactive map called Quarantine Your City on which fans of the latest Oren Peli thriller, Chernobyl Diaries, could vote to see a special screening in their city. The plot follows a group of modern-day American tourists on an “adventure tour” of Pripyat, the site...