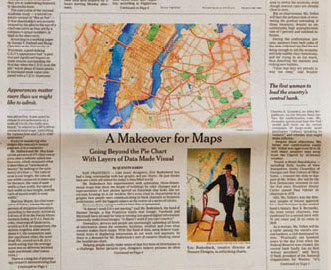
A Makeover for Maps
New York Times
01.06.2014
Like many designers, Eric Rodenbeck has had a long relationship with bar graphs and pie charts. He just thinks they are a little old school for today’s data-filled world.
Mr. Rodenbeck has experimented with animation, three-dimensional maps that show the height of buildings by color changes and a representation of how photos spread on Facebook that looks like ice crystals forming on a car window. He’s even tried to characterize in a graphic how people were communicating in back channels at business conferences, with the biggest talkers at the center of a series of circles.
He is, in short, trying to rethink how data is presented.
“It doesn’t work if it’s not moving,” said Mr. Rodenbeck, the head of Stamen Design, a San Francisco studio that Google, Facebook and Microsoft have all used for help in turning fast-paced digital information into easily understood images. “It doesn’t work if you can’t touch it.”
Mr. Rodenbeck’s comment about using more animation is more than an idea. Just as films are made by shooting 24 still images a second, then running them together to show movement, charts of fast-changing data reports can provide a clearer idea of the information gathered. The animated changes may be shapes on a map growing and shrinking, colors of bar charts changing or positions of lines rising or fading.
“You can’t generate a single design artifact for this much information,” he said. “You have to generate a system that shows the flow.”
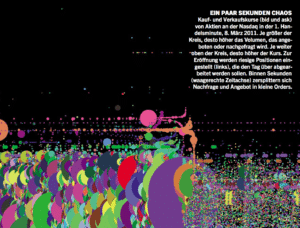
A graphic that Stamen created for the Nasdaq index shows stock trading in increments as brief as a microsecond. Someone investigating the data can interact with the graphic, making it grow or shrink to see different patterns. Those simple changes can allow users to define what they see, to see changes that happen in a single minute, or even a single second, versus changes over a whole day.
Nowadays, devices and people are unceasingly uploading all kinds of information about the economy, locations, weather and even what sweater makes them happy. With this flood of data, some believe traditional ways of displaying information do not work well anymore. So there is a demand for Mr. Rodenbeck’s sort of creative thinking about the humble pie chart.
Helping people easily make sense of that fire hose of information is a challenge. Better pictures (yes, designers believe pictures do often work better than a thousand words) can help. But many designers, particularly in the tech world, are straining for new ways to express information.