
Stamen brings artistry to data visualization — and wins Cooper Hewitt Design Award
KCRW 89.9FM Music, NPR News, Culture Los Angeles
05.17.2017
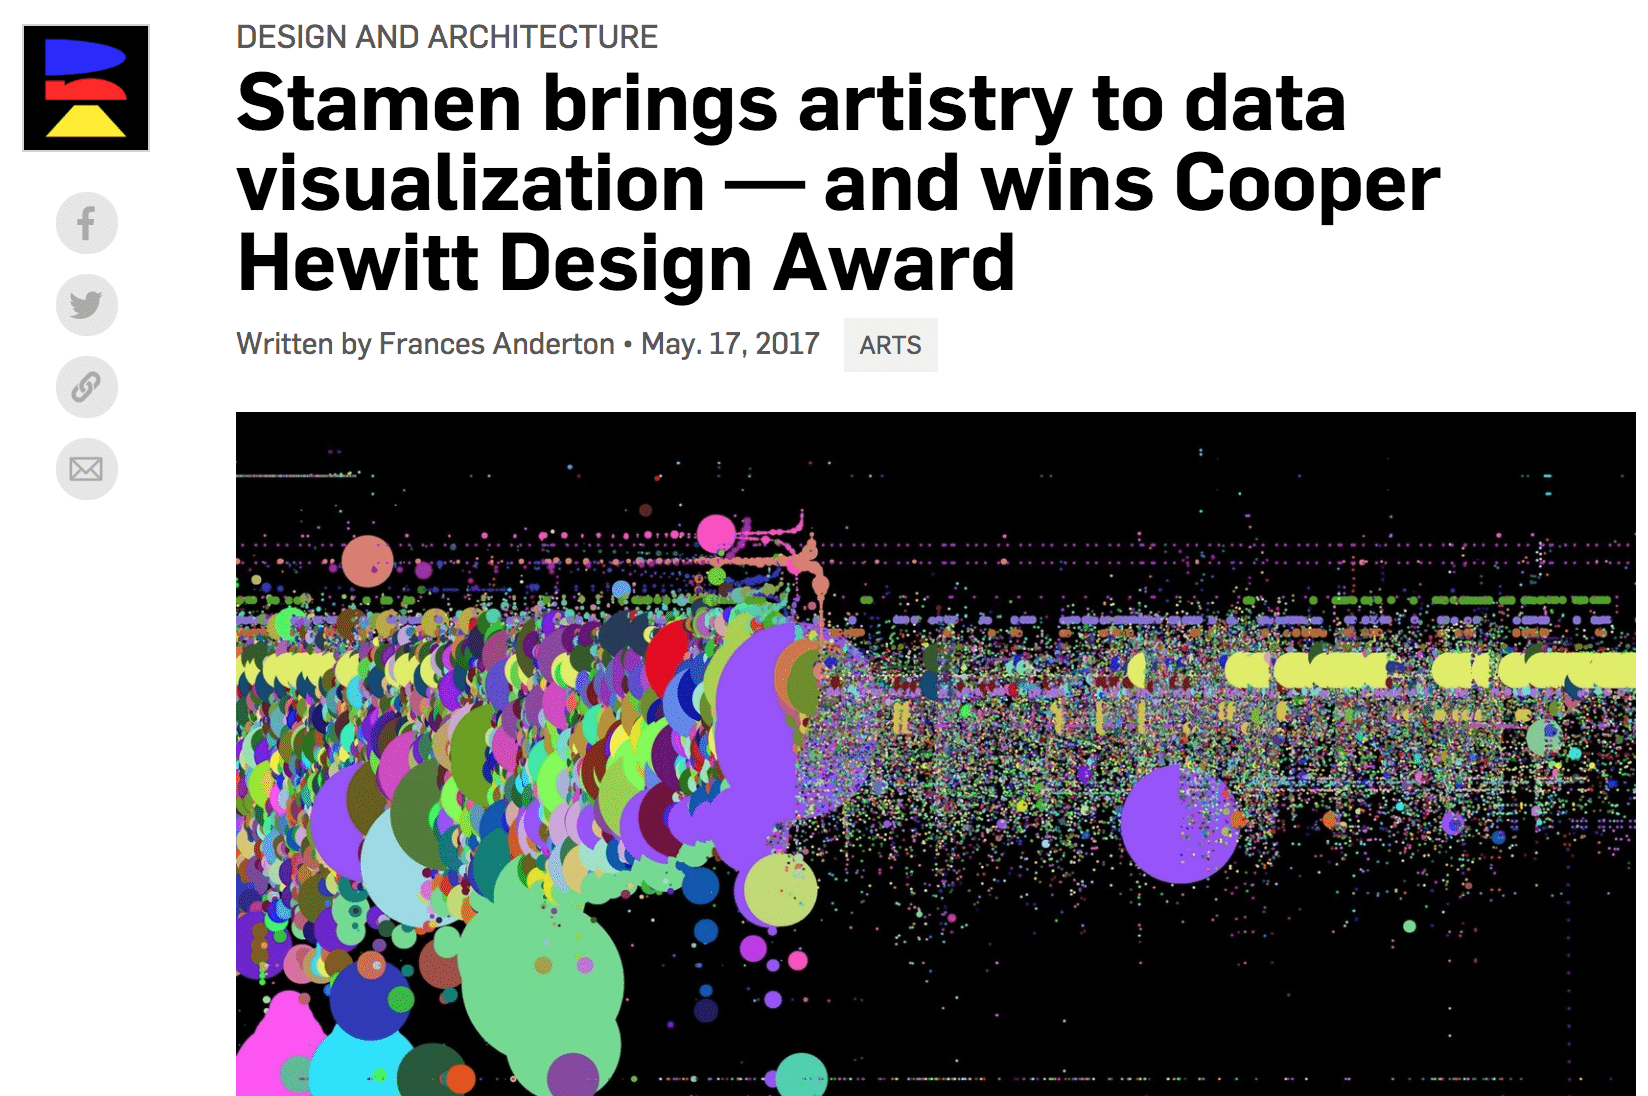
Forget old-school bar graphs and pie charts. Stamen shows that depicting data can be an art form.
New technologies generally produce new art forms. That’s certainly true of today’s mapping and data collection technologies. They’ve given rise to the medium of data visualization, or the visual depiction of data to render it comprehensible and accessible.
One design company, Stamen, has elevated data visualization to an art form. The San Francisco-based company has just been recognized by the Cooper Hewitt Smithsonian Design Museum in New York with a 2017 National Design Award for Interaction Design.
Stamen was founded by Eric Rodenbeck in 2001, because, he says, “the thing that I’ve just seen over the last 15 years of running the shop is just the amounts of data that we’re both collecting and harvesting and then also broadcasting… can be a kind of mysterious thing, that can be a frightening thing, a complicated thing. And what we saw was a need to be able to communicate really clearly and cleanly about that.”
Stamen uses tools from animation to interactive, 3-D maps to turn information into visual stories that range from the utilitarian to the poetic and existential. Examples include a single day of trading on the NASDAQ, sea level rise, immigration patterns, and coalition casualties and their locations in Iraq and Afghanistan. The projects can also be whimsical, as in the case of “Facebook Flowers,” a visual depiction of how an image spreads virally after George Takei posts it on Facebook. They’re also known for Atlas of Emotions (more about this below).
Their work elicits delight — and questions. How do they determine the visual form of a morass of numbers? How do they hit the sweet spot between information and art? And why are maps so popular right now, especially when fewer and fewer people can actually read a map?