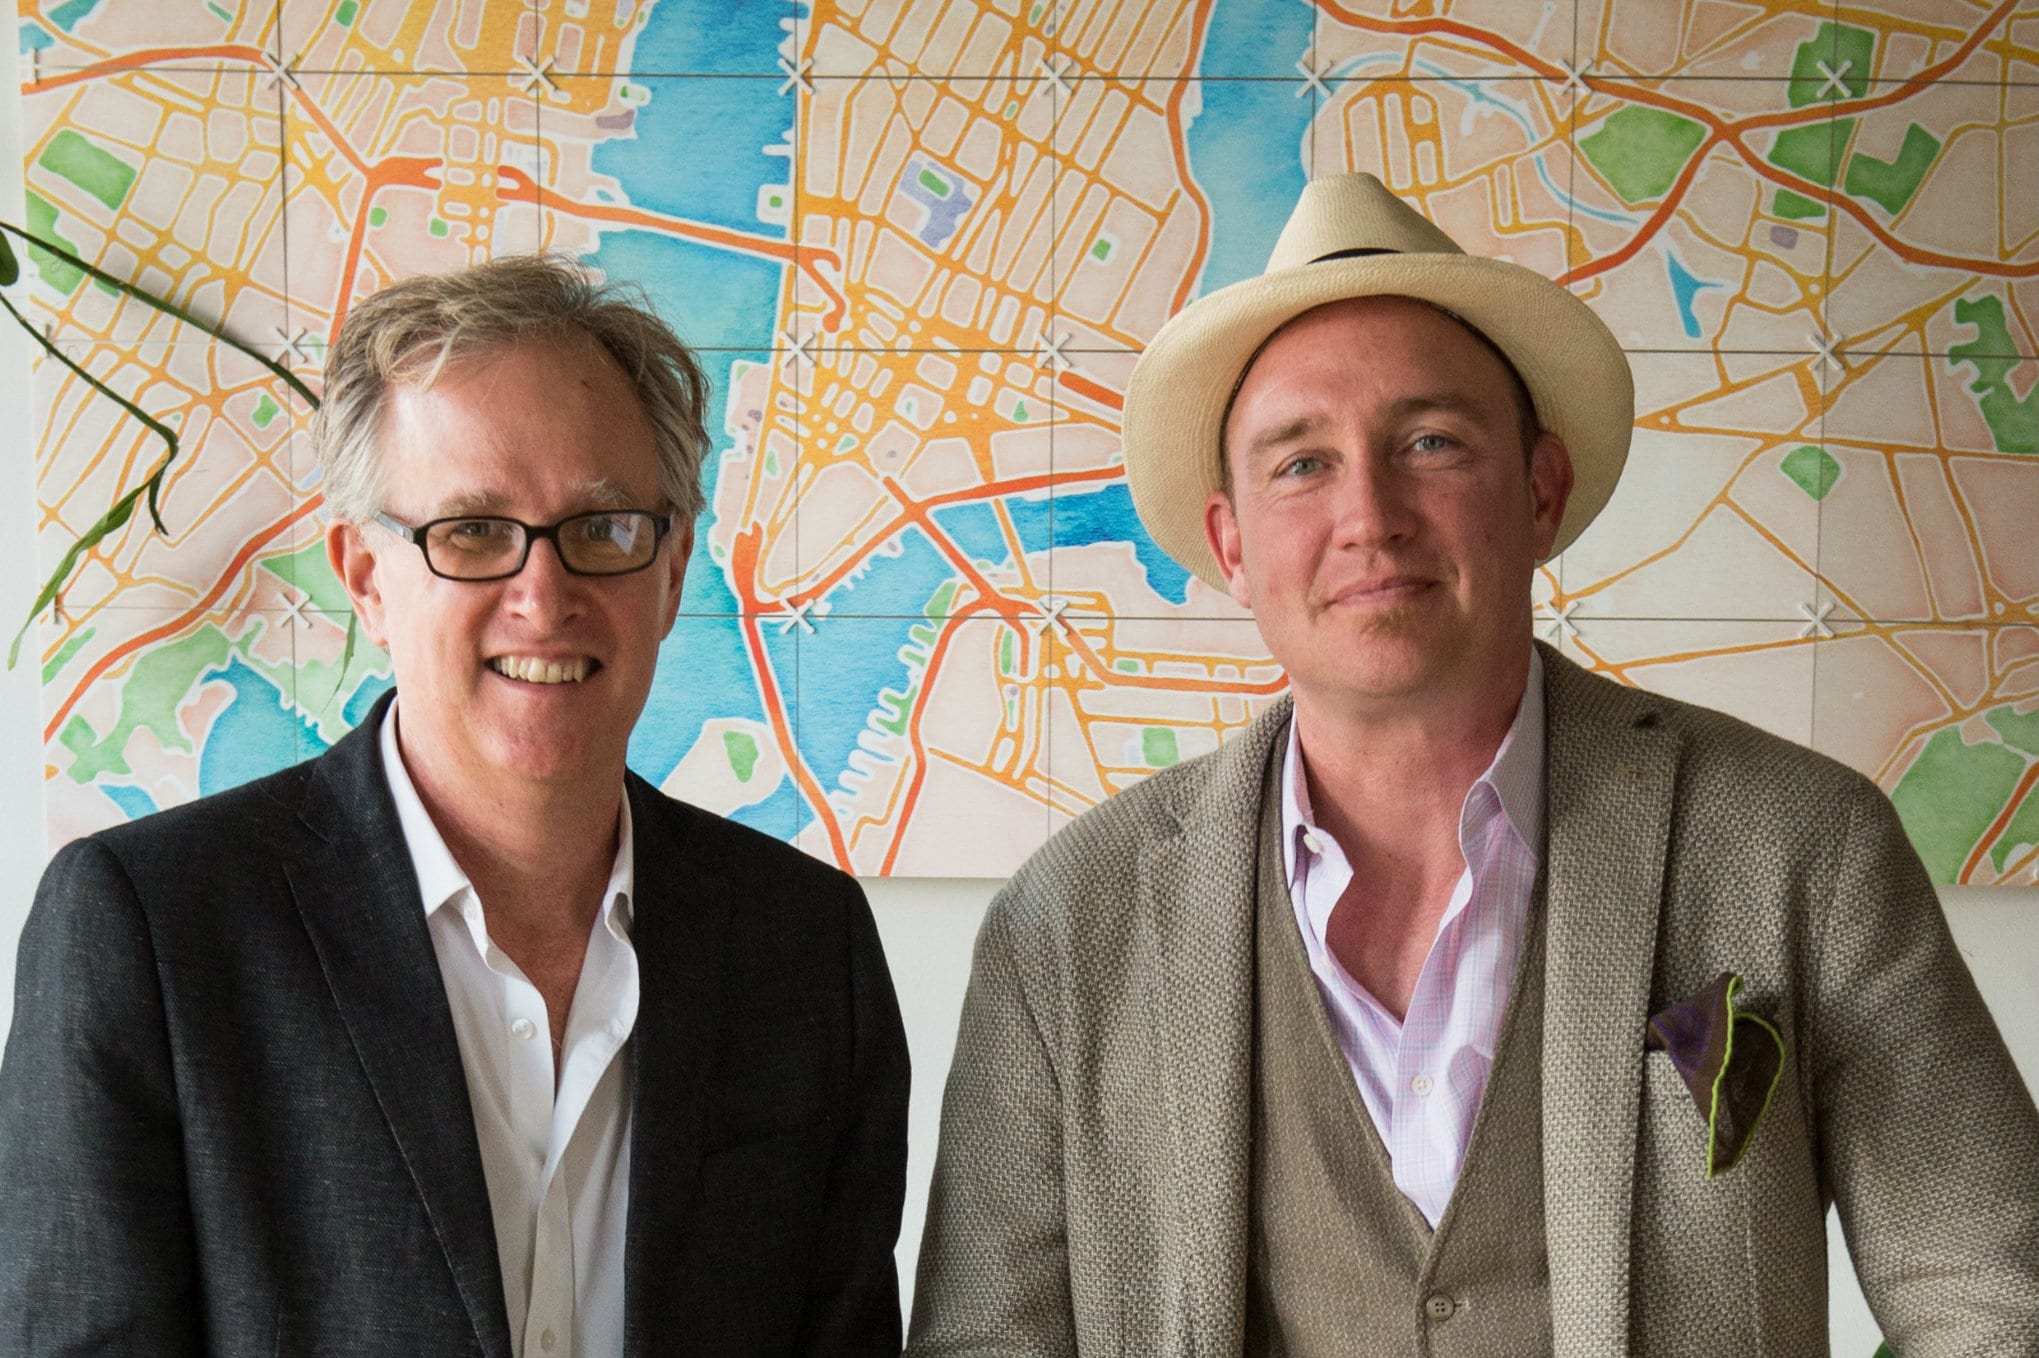
Stamen Design and the “Hippie Geeks” of Data Visualization
XConomy
10.22.2014
Stamen’s founder and CEO Eric Rodenbeck is a well-known pioneer of the data visualization community on the West Coast. Rodenbeck says he fell for the work of data visualization before the dot-com bubble burst, when he was mapping the positions of racing sailboats as the art and narrative director at the website Quokka Sports. He got hooked on presenting data not just as useful analysis, but also as entertainment and as a public service. In 2001 he founded Stamen, and since then his company has made a reputation not only for the beauty of its mapping projects, but also for its work in communicating threats to the environment, such as global warming.
“I didn’t want to make money doing annual reports for cigarette companies during the day, and then do Greenpeace brochures at night,” Rodenbeck says.
The company has charted the environmental impacts of climate change for conservation groups, and designed an interactive map that allows visitors to plot their own routes through the multi-story flow of museum exhibits at the renovated California Academy of Sciences in San Francisco. Nature and the environment are frequent themes for Stamen, but the company has also tracked the spread of real estate developments for Trulia, and built a collaborative online meeting place where BMW designers and production managers make decisions about new car models.
Cami says studios like Stamen are unlikely to lose commercial business by taking a stand on controversial issues such as global warming. In fact, it’s more the reverse, he says. It’s the data visualization studios that may be picky about the clients they’ll accept.

