back All Press

The United States of 2012

Esquire Magazine
02.09.2012

Stamen: Where Does the Money Go?

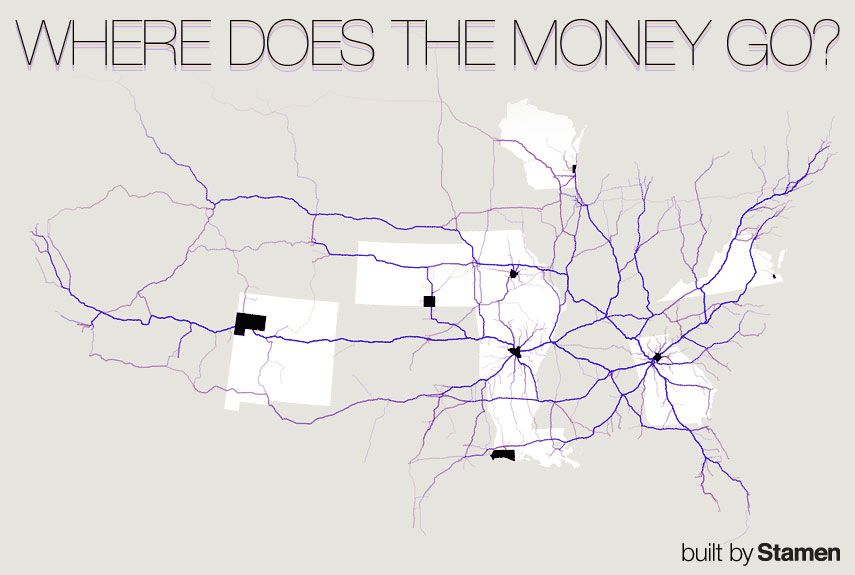
The notion of American class mobility is deeply rooted in the ability to make more money. But class mobility can also be measured in the ability to actually move. Using IRS migration data from the 2009-2010 period — which measures the inflow and outflow of citizens who file taxes from county to county — Eric Rodenbeck and his team at San Francisco-based design firm Stamen created a map of America that is as extreme as ever. By using the IRS figures and mapping them out on U.S. highways with open-source technology provided by OpenStreetMap, they’ve created a roadmap of the parts of America that are losing and gaining, and the results are surprising. “We realized that if you look at the biggest ‘losers,’ essentially what you’re looking at are the biggest cities in the U.S.,” Migurski says. One of those losers: New York county, which lost $1,306,548,000 and 15,100 people. “But does that actually mean New York is a big loser?” Migurski asks. “One of our ideas was that, you’re not a loser if you’re losing money. You’re an exporter.” The sort of exporter, he says, that boosts the rest of the U.S. economy. Traditional Sun Belt retirement areas comprise the gainers; areas like South Florida and Southern California in particular, create what Migurski calls “money sinks.” But between the two is a middle that doesn’t move, that actually exists in the middle: King and Loving counties in Texas remained unchanged. The rural areas between coasts show movement not from coast to coast, but off the beaten path, within state lines. Stamen presents an America that is in both a state of unrest, and unable — or unwilling — to move at all.