A collection of all blog posts by Eric Rodenbeck.

blog/Eric Rodenbeck

Visualizing Superdiversity across global cities with the Max Planck Institute

Eric Rodenbeck | 05.28.19

View the project live at http://www.superdiv.mmg.mpg.de/ Eric Rodenbeck: We’re here with Stamen’s Logan Williams talking about our recent work for the Max Planck institute visualizing super-diversity. What’s the project about? Logan Williams: This was a project initiated by professors at the Max Planck Institute and the University of British Columbia, to show how the nature...
Objects to think with: Some thoughts about the history and present of data visualization…

Eric Rodenbeck | 05.14.19

I was lucky enough to be invited to give the first talk at Visualized 2019 in San Francisco last week. Tamara Munzner, whose book we have at HQ, talked about encoding data. Vetria Byrd teaches dataviz to undergrad students and is seeking to broaden participation in the field. Steve Franconeri discussed principles for annotating visualizations...

Bay Area Soon: a conversation about the future of birds and climate at YBCA

Eric Rodenbeck | 11.07.18

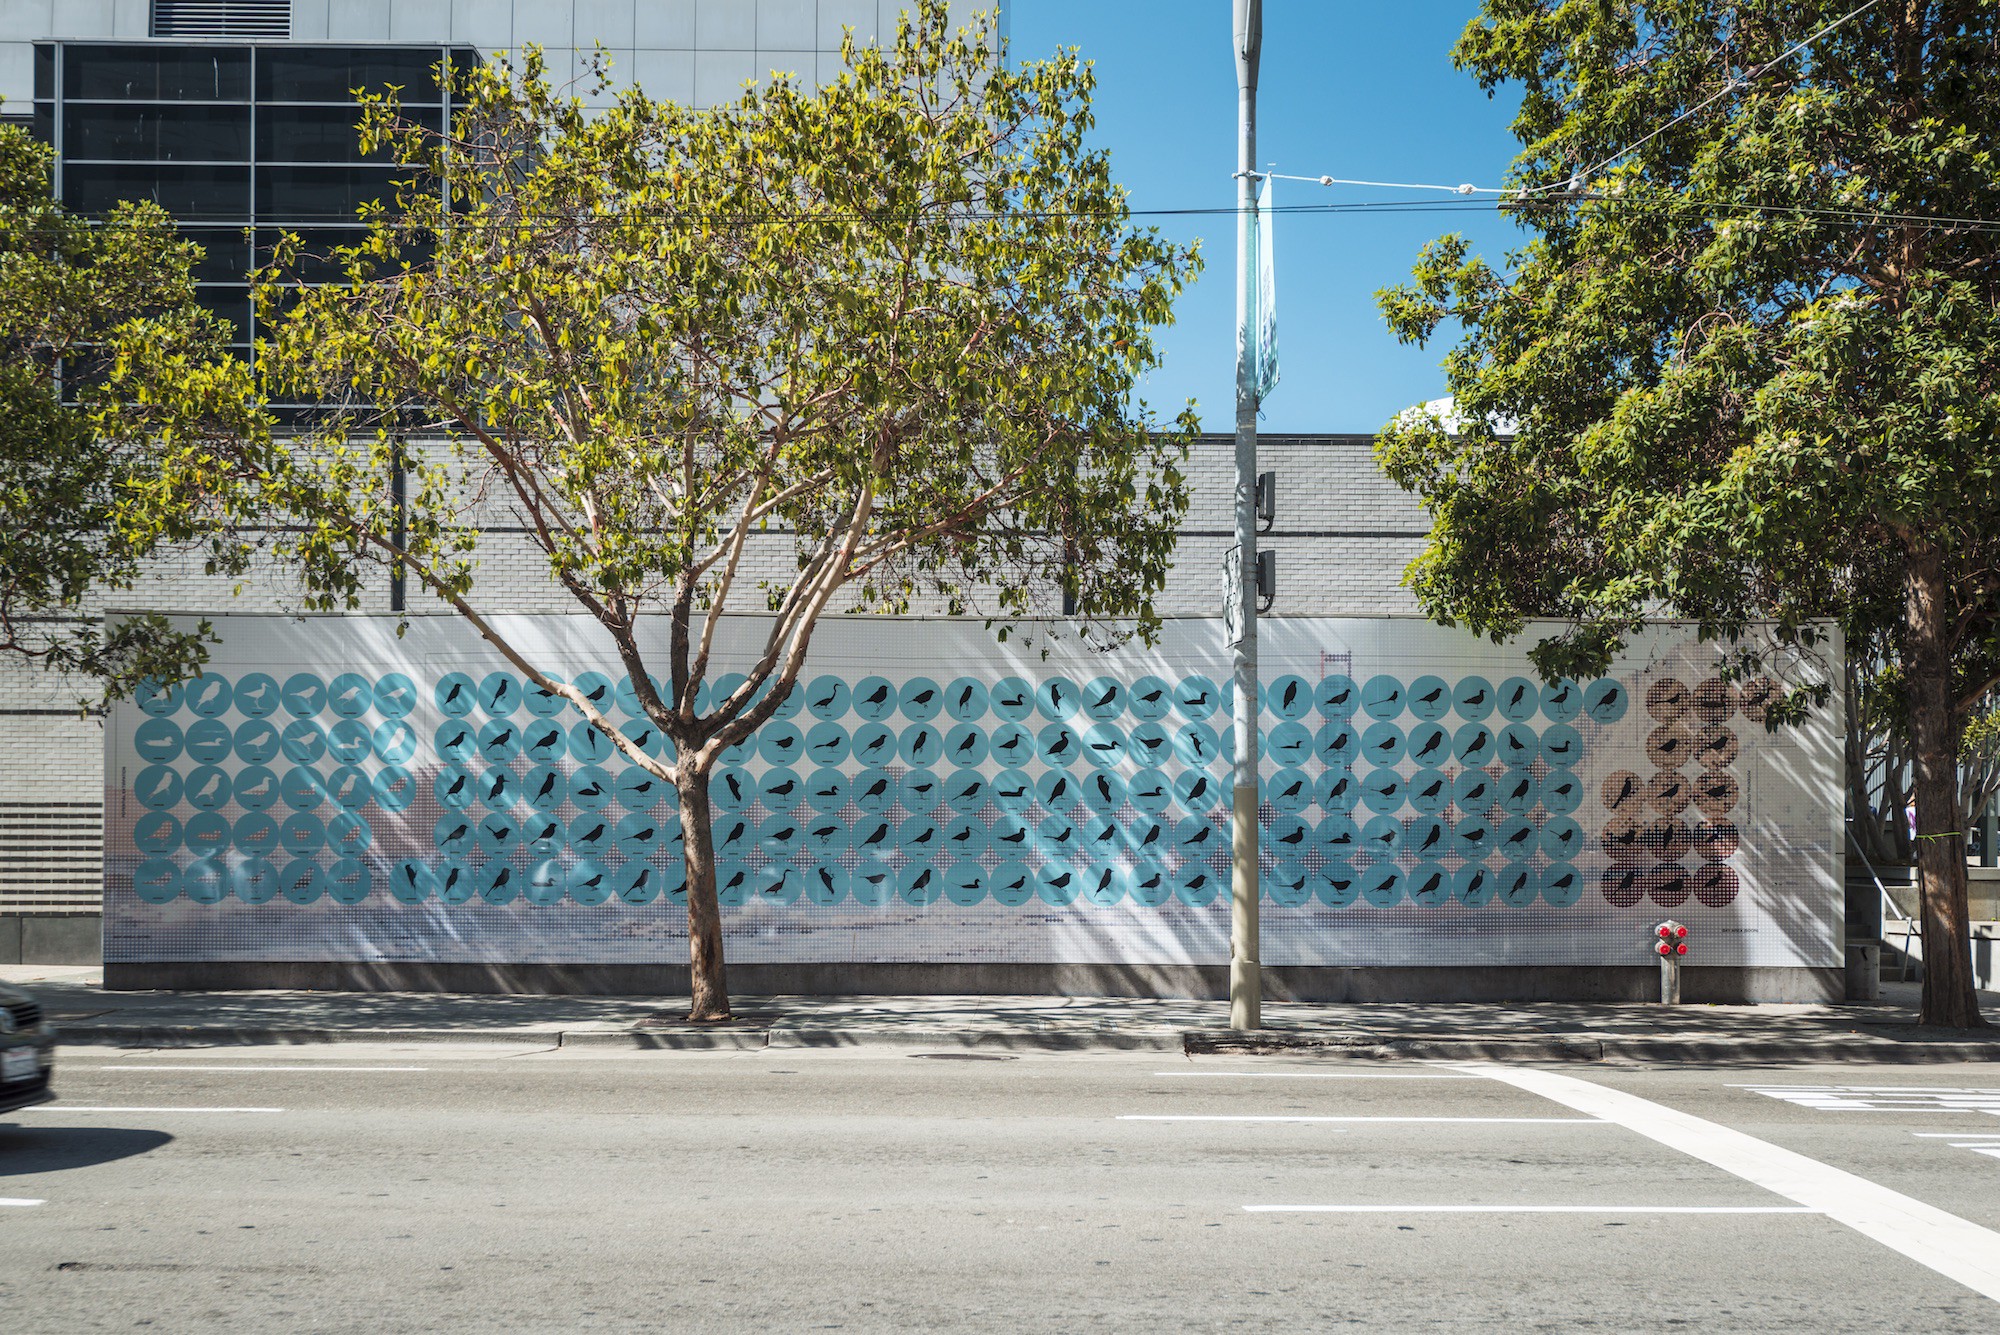
This conversation is about Stamen’s recent mural for YBCA’s Bay Area Now show. The mural, which is 60 feet long and at the corner of Mission and Third Streets in San Francisco, is about the impact that climate change will have on bird populations in the Golden Gate Recreational Area, just north of San Francisco,...

What’s In Your Wallet: Cryptocurrency Coin Correlations

Eric Rodenbeck | 10.30.18

This post originally appeared on Cointracker’s blog and was written by Chandan Lodha. At CoinTracker, we are building a portfolio & tax manager for cryptocurrency. CoinTracker syncs crypto transactions and balances from the top exchanges & wallets to deliver a unified dashboard of your cryptocurrency portfolio performance. CoinTracker also helps users calculate their cryptocurrency taxes...

Talking through Stamen’s Send Me SFMOMA Data Visualization

Eric Rodenbeck | 10.26.18

by Eric Rodenbeck and Keir Winesmith Stamen Design, Send Me SFMOMA data visualization; image courtesy SFMOMA Last June, SFMOMA launched the SMS-based service Send Me SFMOMA. The initiative was conceived as a way to shed light on the museum’s vast collection, only a fraction of which is on view at any given time. Send Me...

What is data visualization for?

Eric Rodenbeck | 05.04.18

“The purpose of visualization is insight, not pictures.” — Manuel Lima, quoting computer scientist Ben Schneiderman “Data visualization is not your creative outlet; data visualization is making data understandable.” — OpenVizConf “[Before the Data Viz Project] there [was] no one place to go, where there are the correct answers for how the data visualizations work.” — Jeppe “Yes, you can design...

The Future of Birds in our National Parks

Eric Rodenbeck | 03.22.18

The birds you expect to see in your favorite National Park may be radically changing soon due to climate change. It’s been a joy and an honor to help the @audubonsociety with the visualizations in this new landmark study called “The Future of Birds in our National Parks,” which launched yesterday. There are three main...

2017: Platforms for new meaning and understanding

Eric Rodenbeck | 01.08.18

2017 was a big year for the shop. We delivered data visualization projects for clients working in: Museums, Cities and Infrastructure, Land conservation in the American West, Global Health, Satellite imagery and neural networks, built some Data visualization platforms and Giant 3d murals, and ran and participated in multiple Data visualization classes & workshops. And...

Fake-but-good-enough-for-robots satellite imagery, drawn by artificial intelligences, at TEDx Bari

Eric Rodenbeck | 11.20.17

This is an abridged version of a talk I gave at the amazing Teatro Petruzelli for TEDx Bari: Disorder on November 19, 2017. All errors are my own. A bundle of digital technologies is reshaping our lives and how we make all kinds of transactions. It’s also reshaping the built environment, as access to digital...

Visualizing Open Spaces for the Peninsula Open Space Trust

Eric Rodenbeck | 11.07.17

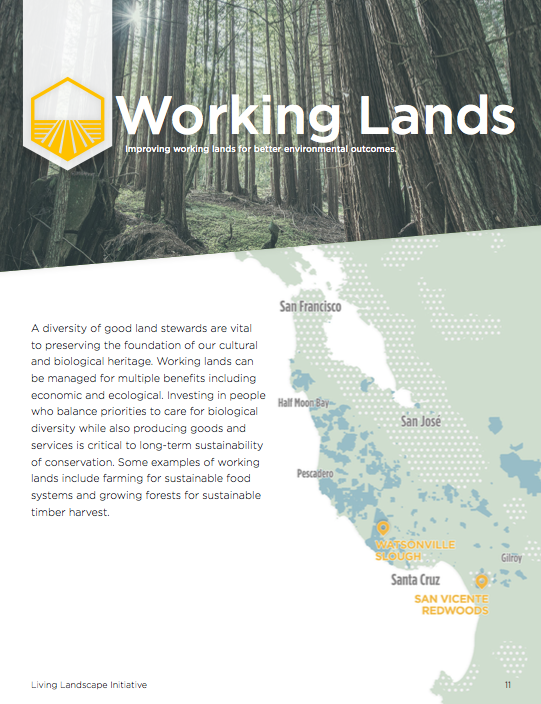
The Living Landscape Initiative Partners have been protecting open spaces for people and wildlife in the South San Francisco Bay Area since the start of the 20th century. With over 235,000 (!) acres of protected lands, 700 (!) miles of streams, 60 (!) square miles of redwood habitat, and 250 (!) miles of trails protected...