A collection of all blog posts by Stamen Design.

blog/Stamen Design

New & Improved Field Papers!

Stamen Design | 07.10.13

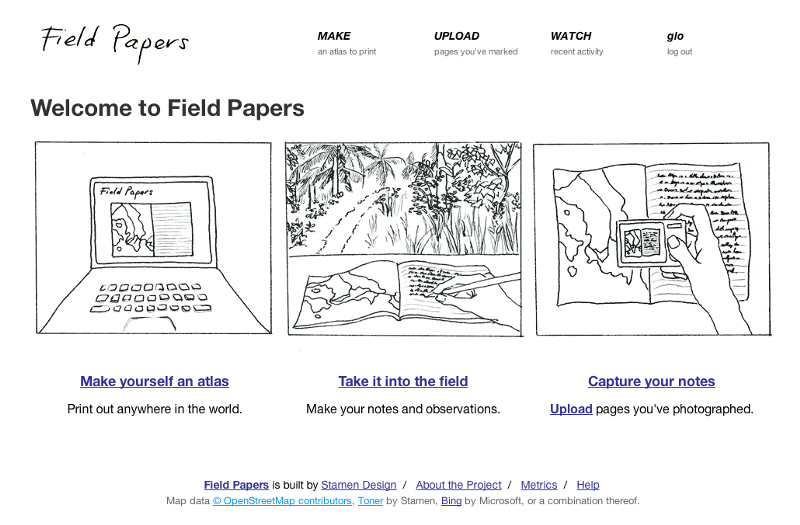
Field Papers is a tool to help you create a multi-page atlas of anywhere in the world. The first version was launched in May of 2012, in partnership with Caerus Associates. In early 2013, we were approached by theU.S. Agency for International Development (USAID) to extend Field Papers, and make it more robust. USAID wanted...

How to make 3d maps of Mars

Stamen Design | 06.27.13

Stamen created maps.stamen.com to showcase our cartographic explorations. It’s also a place to stash our mapping experiments (Burning Map; Trees, Cabs & Crime). We recently added a new map: a three-dimensional map of contour lines that compose the surface of Mars. 1. Motivations I started looking for space-related data shortly after hearing news of the...

Map Stack: Maps for all

Stamen Design | 06.12.13

Good-looking maps used to be the domain of experts. That’s been changing quite a bit in the last few years, and it’s easier than ever now for developers to access mapping data (the recent State of the Map USconference was a great place to hear about this). Never content to leave well enough alone, we...

Earthlings! We have built you 3D Mars maps

Stamen Design | 06.05.13

Last week Mike and I were invited to speak at the Jet Propulsion Lab for “Visualization: From Data to Discovery,” a conference about the overlap between data visualization and science. Which would have been interesting enough on its own (because science is awesome), but the icing on the cake was a tour of the Labs....

Facebook Beatquake: What millions of sound waves traveling through Facebook look like

Stamen Design | 05.28.13

Facebook Stories has just released their third visualization project with us, which we’re affectionately calling “Beatquake.” The project is designed to show listening activity across Facebook over the course of 90 days. We were all surprised how popular Thrift Shop by Macklemore & Ryan Lewis is. It blew out most of the investigative charting we...

Facebook: Engineering a Beatquake

Stamen Design | 05.28.13

Today we want to draw back the curtain on our most recent piece for Facebook Stories: Beatquake. More than 110 million songs, albums and radio stations have been played 40 billion times through apps integrated with open graph. So what does it look like when a song goes viral on Facebook? Inspired by old-school graphic...

New Work: All Over The

Stamen Design | 05.22.13

The California Healthcare Foundation (CHCF) released an update to their “All Over The Map” survey of elective surgery and other procedure rates across the country yesterday. Funded by CHCF, this research is designed to help Californians understand their local healthcare region performs against the California average. Stamen worked with the CHCF a second time on...

Stamen, Maps, and Brightworks

Stamen Design | 05.04.13

Remember being a kid and daydreaming about what it would be like if school wasn’t just rows of desks and boring classes? What if you could go to a school where, instead of memorizing facts you may never reference again, you learned how to garden, make art, build things (based on math equations!), and work...

Grasses, Watermen & Bathymetry

Stamen Design | 04.22.13

Today we’re announcing a new cartography and storytelling project called Chesapeake Bay Grasses with the Chesapeake Bay Program (CBP), a partnership of federal, state, non-profit organizations and academic institutions dedicated to the protection and restoration of the Bay. Stamen has been working with the CBP to develop a visual story about the health of the...

Found on campus: a Stamen map of Palo Alto in tablecloth form

Stamen Design | 04.17.13

News flash: maps transform from paper things to digital things to things all over the map with maps all over them. We were delighted to receive an invitation to the Stanford Cool Product Expo, a yearly showcase of innovative companies and products produced by Stanford’s MBA students. Stamen was one of 45 producers invited to...