
News flash: maps transform from paper things to digital things to things all over the map with maps all over them.
We were delighted to receive an invitation to the Stanford Cool Product Expo, a yearly showcase of innovative companies and products produced by Stanford’s MBA students.
Stamen was one of 45 producers invited to show on campus, alongside Sifteo (fun game cubes), Node (modular sensing devices),Stealth HD (360 cameras), and Oru Kayak (a kayak that folds like origami into itself) (no really!). Not exactly makers of products ourselves (yet!), we invited collaborators Soft Cities and DODOcase to join us. More on that second collaboration coming soon. Promise!
We spent the entire day talking about maps. About why pretty maps matter. About how maps are for more than wayfinding and how data visualizations are also maps. About why people love maps and how they connect us. About how maps.stamen.com connects people to making their very own maps. About all of the places a map can take us, and all of the places where maps can go.
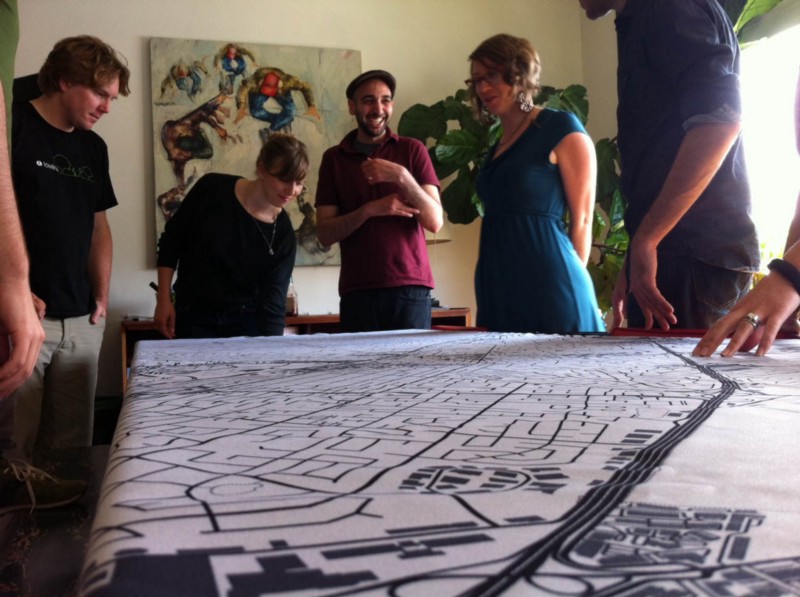
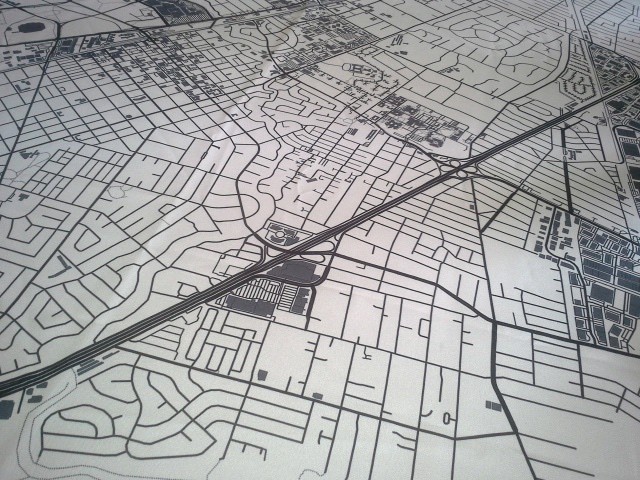
Like tablecloths.
You know this place? It’s Palo Alto mapped with Toner on a tablecloth, inked by Nikki at Soft Cities for our expo table (as well as the table in the studio, above).(She can also make you one of Peoria, Paris or Phalaborwa with napkins to match.)
It’s always inspiring to see people take Stamen’s maps into the tangible world (see: sneakers and cupcakes) and something we’ll be doing more in the future, as we have with projects like the Watercolor prints.
Watch this space! Where will the maps go next?