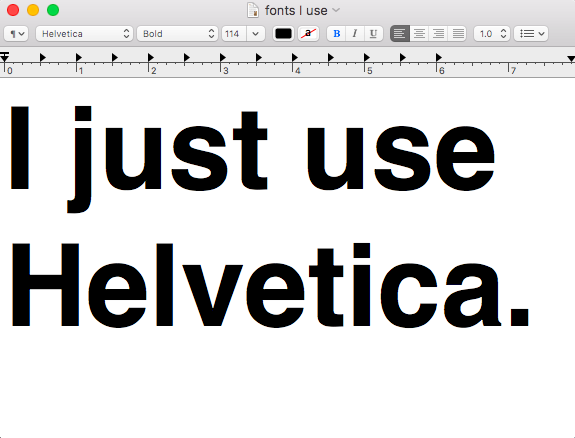
The National Design Award-winning interactive designer has a simple method for selecting typefaces—as detailed in his 20 year career designing for the web
About Stamen
Stamen is a globally recognized strategic design partner and one of the most established cartography and data visualization studios in the industry. For over two decades, Stamen has been helping industry giants, universities, and civic-minded organizations alike bring their ideas to life through designing and storytelling with data. We specialize in translating raw data into interactive visuals that inform, inspire and incite action. At the heart of this is our commitment to research and ensuring we understand the challenges we face. We embrace ambiguity, we thrive in data, and we exist to build tools that educate and inspire our audiences to act.
Related Posts
Maps and visualizations we’re keeping an eye on for Election Day, Part 3: Down-ballot races and electoral math
Welcome to the third and final part of our series on maps and data visualizations in advance of the 2024 U.S. General Election (if you’re just catching up, here are parts one and two). Today, we’ll close with discussion of Congressional races and the electoral college. I’m just a bill We’ve mostly discussed the presidential...
Maps and visualizations we’re keeping an eye on for Election Day, Part 2: Indicators
Welcome to part two of our series on maps and data visualizations in advance of the 2024 U.S. General Election (if you missed it, here’s part one on polling). Today, we’re discussing other indicators of political outcomes, including money in politics, changing demographics, key issues, and previous elections. Here comes the money Politics is all...
Maps and visualizations we’re keeping an eye on for Election Day, Part 1: Polling
This is a perfect encapsulation of how we’re all feeling: unsettled. The presidential race has been neck-and-neck for months, even before President Biden decided to step off the ticket back in July. As the 2024 general election approaches, we thought we’d dig into some maps and visualizations of election data from across the media landscape...