
An AI Tool Predicts City Wealth Based on Satellite Imagery
Hyperallergic
08.01.2017
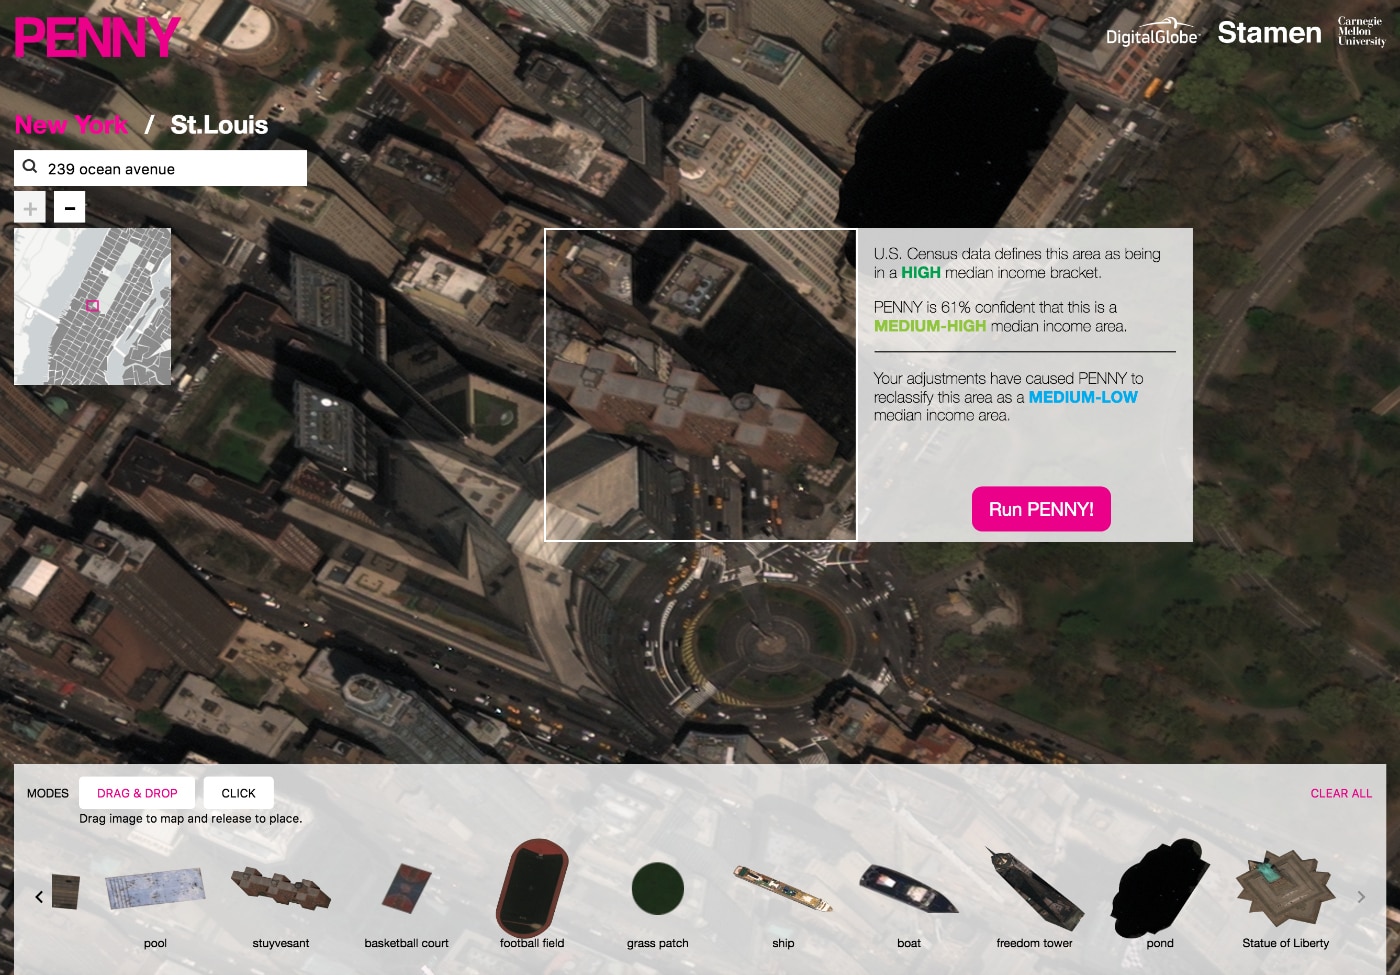
Using available census data and satellite imagery, researchers trained an artificial intelligence (AI) called “Penny” to predict the median household income of neighborhoods in New York City and St. Louis. Created by researchers at Carnegie Mellon University with Stamen Design, Penny analyzes DigitalGlobe imagery in its neural network, resulting in algorithms that recognize repetitive architecture and baseball diamonds as low-income areas, and glass skyscrapers and plenty of green space as high-income.
Users can add digital objects to the maps and then run Penny for a new classification. Some of these additions are a bit whimsical, such as a huge ship or the Statue of Liberty (which I found raised the income of the Upper East Side when plunked on its streets); others respond to patterns of neighborhoods, like a high rise which tends to raise the income, or train yard that will lower it.
Penny is imperfect in its predictions. The information for both St. Louis and New York can’t be applied to other urban areas with accuracy. Robbie Gonzalez at Wired pointed out that adding a helipad to Trump Tower actually lowers its income classification (maybe it thinks the building is a hospital). I also discovered in exploring Penny’s classifications for Brooklyn that gentrified neighborhoods including Williamsburg and some of Park Slope were low-income, perhaps due to their uniform, sometimes industrial, architecture. However, it’s more an experiment in machine learning, as well as a demonstration of how the planning of cities can so regularly under-serve certain income levels that even satellite imagery can see it.