
You Have Eric Rodenbeck to Thank for All Those Sweet Infographics
Bloomberg Business Week
09.19.2017
The graphic designer didn’t create the modern-day data visualization, but he certainly popularized and arguably perfected it.
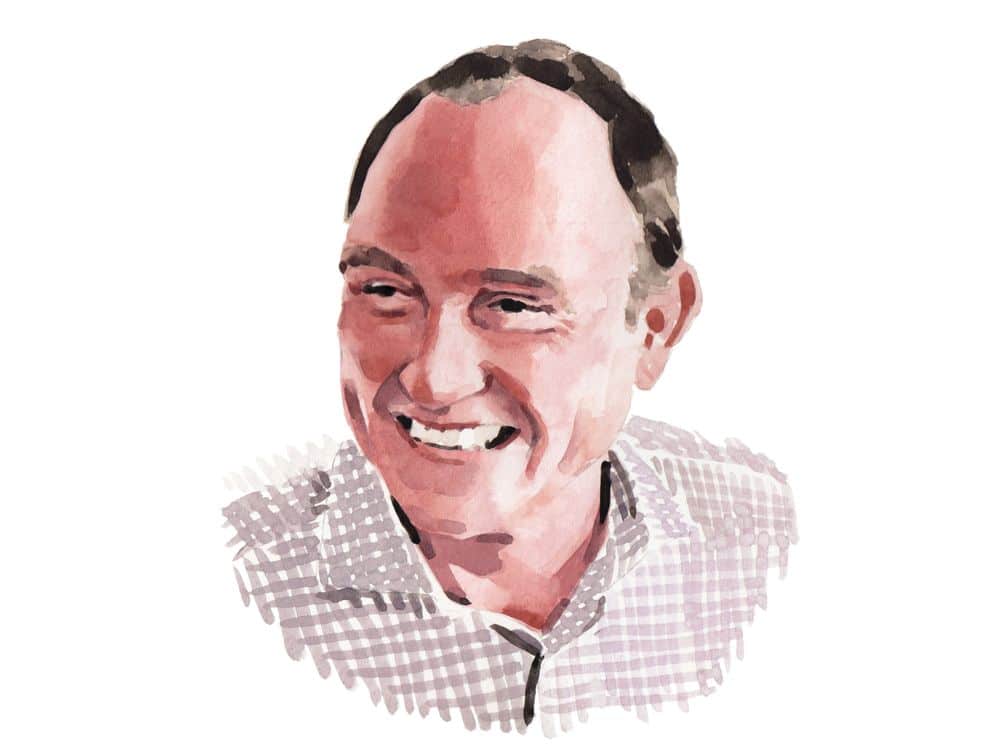
Eric Rodenbeck, the son of German immigrants who settled in Queens, N.Y., was the first in his family to make it to college. Once he got there, though, “I couldn’t figure out what the hell they were talking about,” he says. It was the early 1990s in the architecture program at Cooper Union, and minimalism reigned. Rodenbeck balked. “I was more interested in watching materials flow and building shapes than thinking ahead [to] what it’s going to look like,” he says. He was expelled before he finished his second year—but wound up no worse for the experience.
Rodenbeck is the founder of the graphics company Stamen Design LLC, which he started in 2001 so he could do the thing he’d dreamed about at Cooper Union: use patterns, numbers, and images to communicate big concepts. “I had an appreciation for the pop culture nature of this as a mass-media format to do more than communicate a fact or two,” he says. Data visualization’s roots in technical disciplines such as computer programming have “shackled it,” he says. “I’ve always been interested in breaking free of those boundaries.”
After Cooper Union, Rodenbeck moved to San Francisco and fell in with the growing tech community there. While working for Quokka Sports Inc., a sports agency-cum-digital startup, he taught himself to code by copying and pasting from the internet. He used the company’s online platform to provide the first real-time coverage of a round-the-world sailing race, combining GPS data with emails, photos, and video from the sailors. “His work is like data poetry,” says Michael Gough, Rodenbeck’s former boss at Quokka, now a corporate vice president for design at Microsoft Corp. “He’s very clever, but there’s an edginess about him, an intensity.”
Stamen’s projects have included crafting interactive maps for sporting events, representing emotions in images and charts to explain the Dalai Lama’s philosophy, and using census figures and maps to predict regional income levels. Rodenbeck’s clients—Facebook Inc., the World Health Organization, nongovernmental organizations, and museums—are as varied as his work. “A lot of times I have no idea what the project is, but I take it anyway,” he says with a laugh.
Rodenbeck is still fascinated with “making hidden data consumable,” as he puts it. His office is filled with globes, charts, and maps, which he considers a communication medium. “The world is ripe for mapping,” he says. In October his company will be honored at the Cooper Hewitt National Design Awards Gala, the Oscars of the design world. “As someone who was expelled from [Cooper Union], to win the national design award is a great irony,” Rodenbeck says. “I’ve had a chip on my shoulder about it since I was 19 years old.”