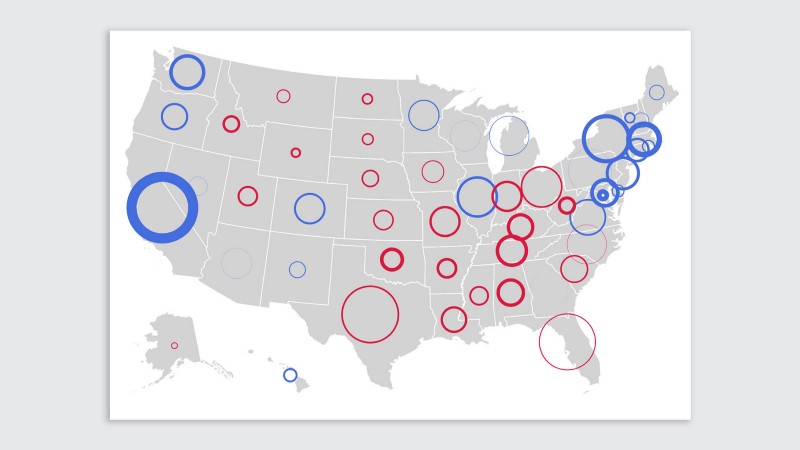
Last November, as part of Stamen’s 2020 roundup of presidential election maps (“We design maps for a living. Here’s who got the 2020 election right“) published in Fast Company, I sketched out the idea for a new kind of election map which I hadn’t seen implemented before. The map shows a colored ring for each state where the outer radius is the number of votes for the winning candidate in each state, and the inner radius shows the number of votes for the loser.
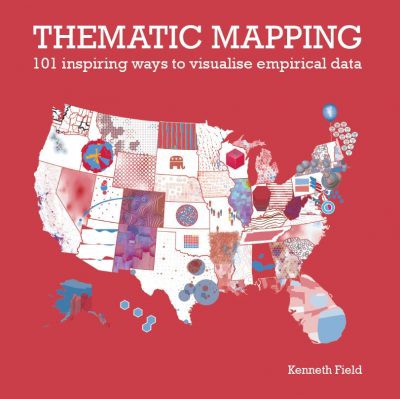
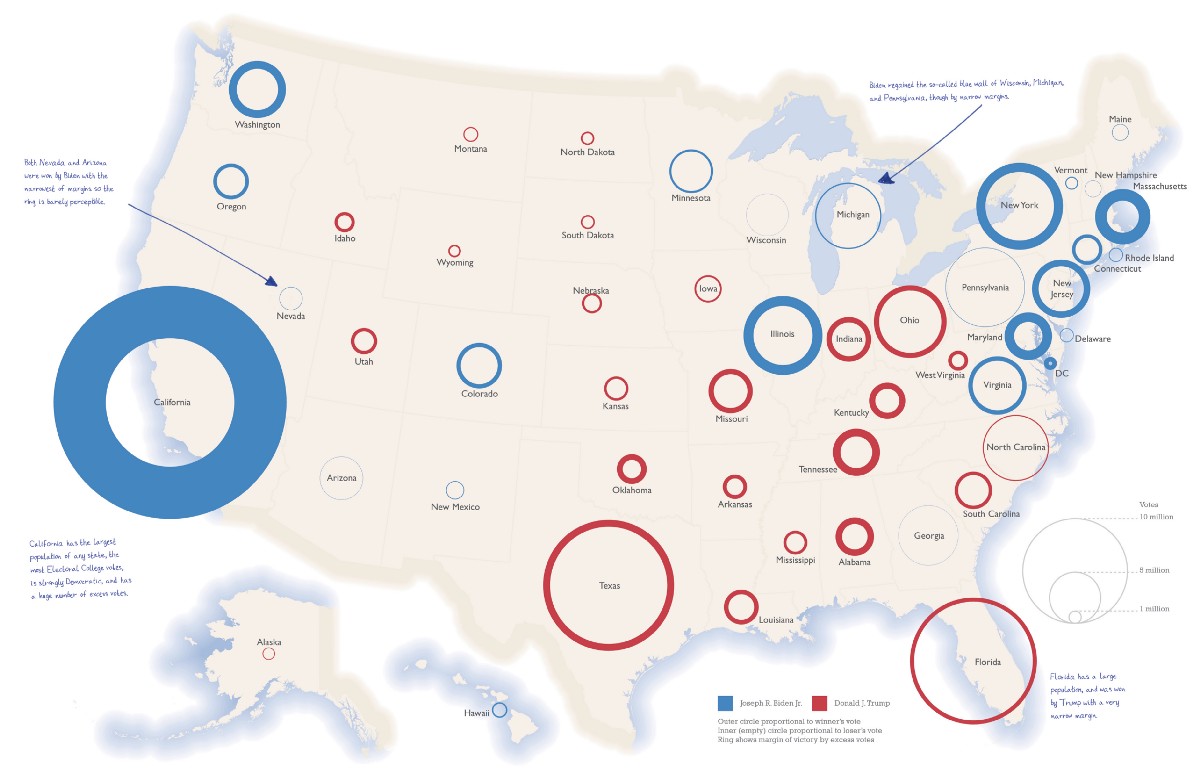
Around the same time, well-known esri cartographer and author Kenneth Field was putting the finishing touches on his latest book Thematic Mapping: 101 Inspiring Ways to Visualise Empirical Data, packed with examples of quantitative maps all using the same dataset: the 2016 electoral college results. Despite having completed 101 maps and having nearly sent the final draft off to the printer, Ken slipped in a (much improved) version of the Ring Map on the final page of the epilogue. Behold, map number 102 in a book of 101 maps:
I’m very pleased to see this refined version of the map out in the world, and I’m curious to hear if this map type sparks any new insights with other people.
For me it’s especially resonant not just as a new look at the regional dynamics of the election, but also because of how it illustrates the acute flaws in the Electoral College itself. The Electoral College is vestigial and archaic in many ways, consisting of a nationwide collection of winner-take-all competitions that depresses turnout and demotivates voters in non-competitive states, resulting in millions of wasted votes that make no difference in the ultimate outcome of the election. A fairer system would use Proportional Representation or a National Popular Vote so that all votes would count equally… but I could talk about that for days and days and it’s a topic for another time.
Anyway, as you can tell, election maps are my jam, and I’m so pleased to be included in Ken’s massive book of so many other fascinating maps. His book will be released next week (August 31st) but you can pre-order the eBook on Amazon right now.