Mapping Historical New York: A Digital Atlas
Mapping how populations in New York City changed from 1850 to 1940 and beyond


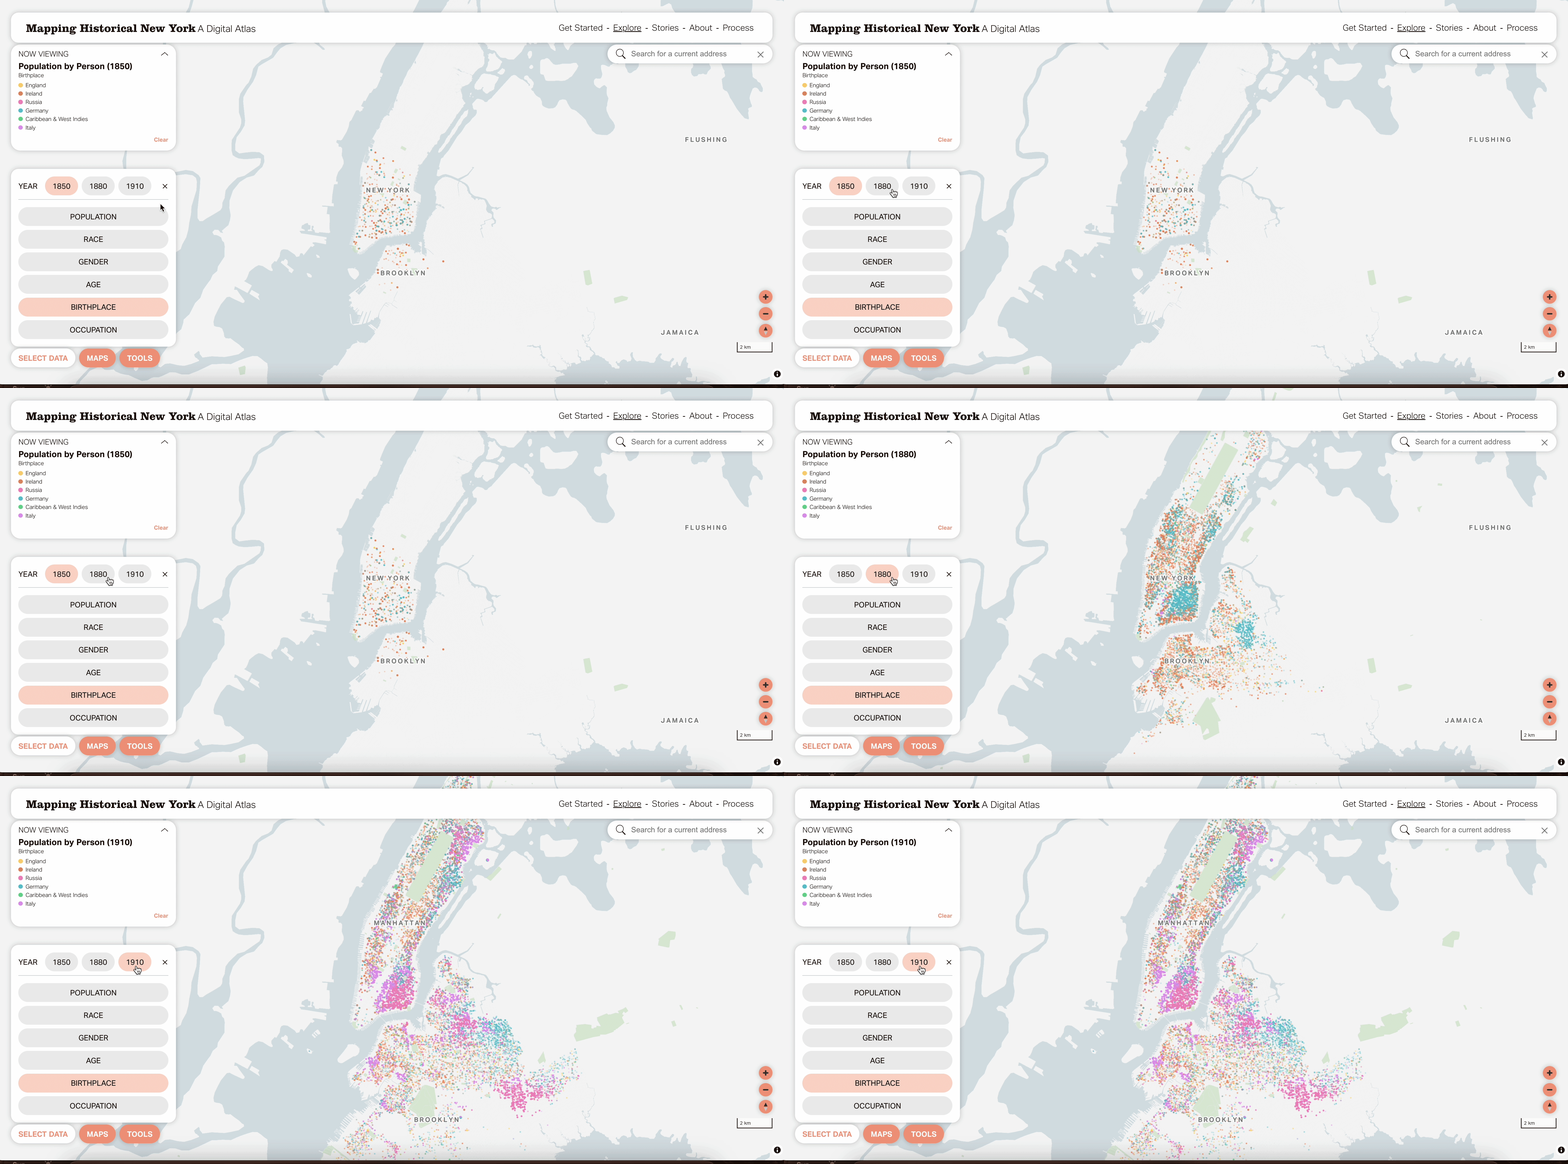
Columbia University’s Center for Spatial Research came to us with a large and unique dataset of historical census data for the areas that are now Manhattan and Brooklyn dating back to 1850. In addition to being aggregated at various geographical units (such as city blocks and wards), the data was also available at the building and individual levels.
We visualized the data in a type of dot density map with enhanced street level zoom effects and overlaid historical maps to add texture. Mapping Historical New York attempts to communicate the city’s rich history in a visually engaging manner, catering to historians, urban planners, and the wider public alike. Listen to us talk to Dan Miller from the Center for Spatial Research on our podcast.

