Redesigning the Distressed Communities Index
Collaborating with the Economic Innovation Group


Background
Economic Innovation Group (EIG) approached Stamen with the goal to redesign their renowned Distressed Communities Index (DCI). The index categorizes zip codes, counties, cities, districts, and states into five quintiles of well-being: prosperous, comfortable, mid-tier, at risk, and distressed. It was necessary to preserve the integrity of the data and surrounding resources such as downloading the data and learning through reports. Our goal was to refresh the interface that incorporated new features to add new insight to the data as well as create a new immersive feel.
What we built
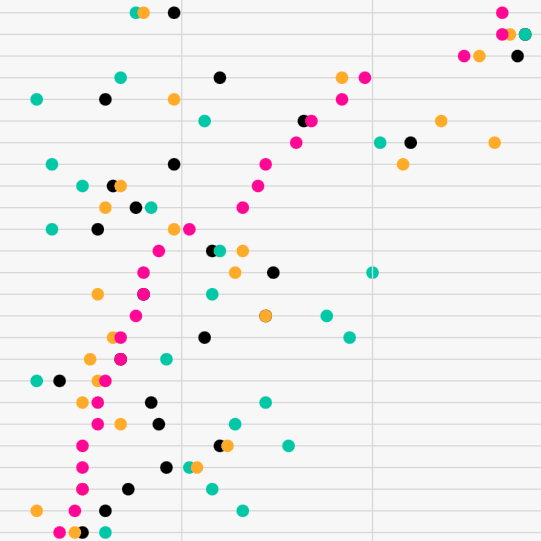
Our first task at hand was to redesign the entire interface to remove information that got lost below the scroll and re-establish focus on the map. We determined a new color palette, and secondary visualizations that help guide users in non-linear exploration of the index. Additional information is revealed as the user continues to dive deeper into the index. While we wanted to ensure users could download the dataset to do their own research, we wove in new secondary visuals so more analysis can be done with the tool itself. We also added additional resources such as stories that users can step through to understand the significance of the index as well as information about the data itself.


