
Tracking viruses with WastewaterSCAN
Designing a platform for visualizing virus data from wastewater treatment plants
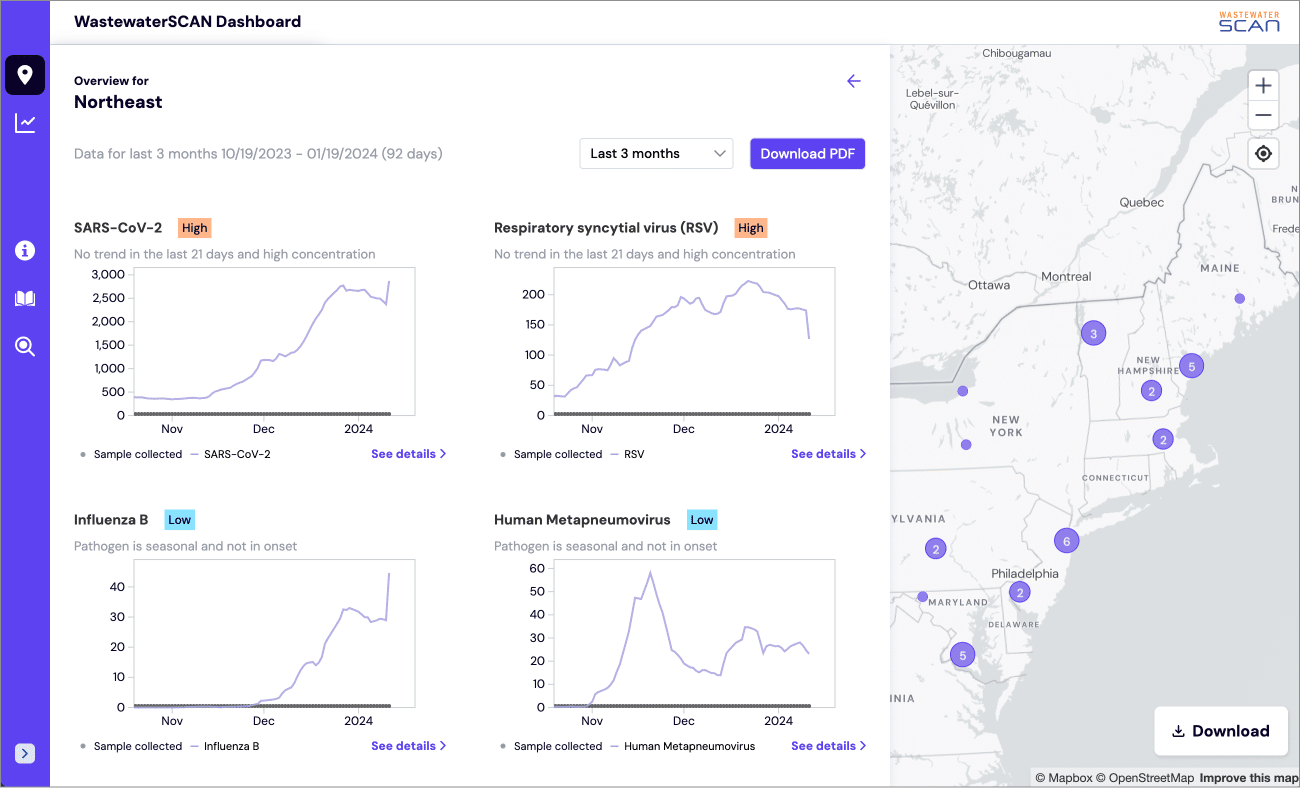
What if you could check pathogen levels like you do the weather? We collaborated with WastewaterSCAN to develop a comprehensive platform for visualizing virus data collected from wastewater treatment plants across the United States. This initiative is in part due to the shift in COVID-19 data collection now, with most people self-testing or foregoing testing all together. WastewaterSCAN, a collaboration between Stanford and Emory Universities, industry partners, and philanthropic groups, aims to facilitate pathogen testing in municipal wastewater treatment plants at no cost to participating municipalities. Recognizing their impending growth in testing for more pathogens and expanding from tens to hundreds of treatment plants, the group sought Stamen’s assistance in creating a robust tool capable of handling diverse data visualization needs.
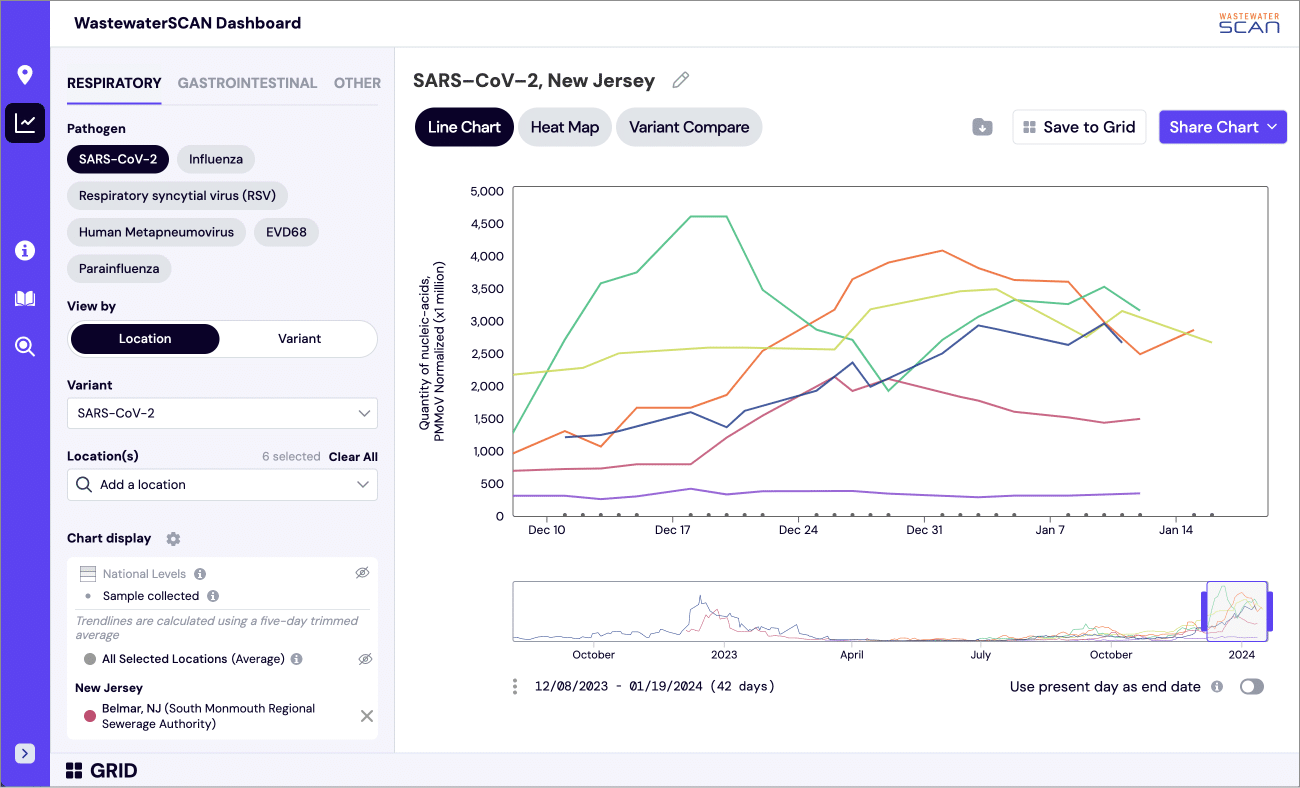
Stamen’s primary focus was on accuracy, ensuring that the map, charts, and messaging accurately represented the data. We transformed the data into a chart builder, combining ways to view multiple virus by in various ways, while also allowing users to customize and export analyses. As the project grew, we expanded our audience to focus on the general public, and we designed the map component of the platform with these users specifically in mind. Our goal was that, at a glance, users could see how the nation, region, or even city could be categorizing pathogen levels and use that information to determine their travel or day-to-day plans. Over the multi-year engagement with WastewaterSCAN, the site continues to become richer in information as more wastewater treatment plants, pathogens, and variants are added.