
Stamen is taking on the 2026 #30DayMapChallenge as a team, and nine days in we have nine maps from four of us: Alan McConchie, Kelsey Taylor, Alex Parlato, and Vinay Dixit. Each day of November brings a new prompt, and so far that has meant backwards clocks, Halloween candy, wine regions dating back to 2000 BC and the town from Severance.
Here are our maps from the first nine days. Each one lives on our #30DayMapChallenge page, which we will update daily as new ones come in.
Day 1 · Points: Backwards Clocks
Alan McConchie
British Columbia stopped changing its clocks in 2026 and now stays on UTC−7 all year, while Washington State still falls back each winter. So from November to March, driving from Seattle to Vancouver means going north and slightly west, yet setting your watch an hour ahead.
I went looking for every place like that: pairs of nearby cities where the more easterly one keeps the earlier clock. I found 18, from Vancouver and Seattle to Bishkek and Almaty, and Biratnagar and Siliguri, where the gap is just 15 minutes.

Day 2 · Lines: Interrupted Contours
Alan McConchie
Contour lines are supposed to be unbroken curves of equal elevation. Interrupted Contours asks what happens when they aren’t, and whether broken lines can show a landscape in a new way.
There are two modes: In Shadow Density, more lines gather in shadow and fewer in light, so line density reads as steepness. In Minimum Spacing, contours are drawn in priority order and dropped wherever they crowd together. Everything is generated in the browser, tile by tile, and you can animate the light to watch the terrain shift.

Day 3 · Polygons: Voronoi Highways
Alan McConchie
Every point in the lower 48 is colored by two things: its nearest north–south (odd-numbered) Interstate and its nearest east–west (even-numbered) one. The result is a patchwork of polygons in a two-way color scheme. You can pick a palette, build your own, or let the map drift through all of them.
Day 4 · Clusters: Candy Clusters
Kelsey Taylor
Just in time for Halloween leftovers, Candy Clusters shows each state’s most popular Halloween candy as a circle filled with a photo of that candy and sized by the state’s population. Pick a candy to see where it rules a whole region, or flip between 2024, 2025 and 2026. Each state label is set in a free font picked to echo that brand’s packaging lettering.

Day 5 · Senses: Sight: Viewshed Viewer
Alex Parlato
The prompt asked how you see something, and suggested a viewshed. Alex built a tool for exploring them: click anywhere on the map to place an observer, and the Viewshed Viewer calculates lines of sight across the terrain from elevation data to show what that person could see, and what’s hidden behind the hills.

Day 6 · Vintage: Vin-t-age
Kelsey Taylor
Kelsey read “vintage” the way a sommelier would. “Vin-t-age” maps the protected wine regions of France, Spain and Italy (those with a Protected Designation of Origin), shaded by how long winemaking has been documented there, from 2000 BC to after 1800.
Click a region to zoom in and see when its vines took root, or filter to regions growing red or white grapes. The old-world serif lettering gives the whole map the feel of a wine label.

Day 7 · 10 minute map: The Funkiest Interstate in America
D. Vinay Dixit
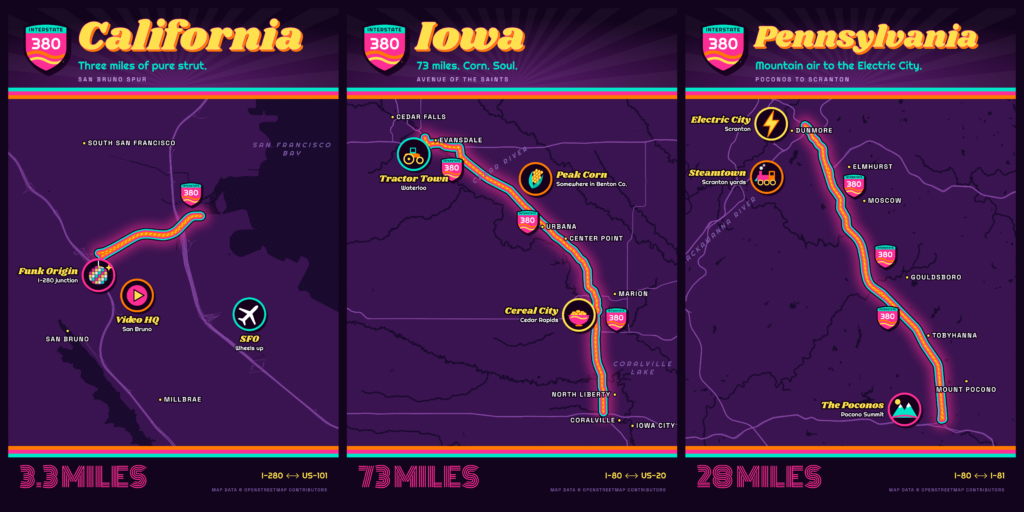
Vinay drives Interstate 380 at least once a week: it’s the 3.3-mile spur between I-280 and US-101 in San Bruno, California, and it takes up most of a seven-minute run to Costco. Then he learned there are two other I-380s, in Iowa and Pennsylvania, and none of them meet.
The result is a neon triptych of retro road posters: 3.3 miles of “pure strut”, 73 miles of “Corn. Soul.” from Waterloo to Iowa City, and 28 miles from the Poconos to Scranton.
Day 8 · Utopia: In Perpetuity
Kelsey Taylor
What’s more utopian than a job you never remember? Kelsey’s second map this week charts the world of Severance: Lumon Headquarters, the town of Kier, PE, Dieter Eagan National Forest and its record-breaking waterfall, Ganz, and the harbor town of Salt’s Neck.
Select a location to light it up and read about it, with links to Severance.wiki for more. As the map warns, nothing is to scale and the distances between places are unknown. Try to enjoy each location equally.

Day 9 · Urban-rural: Where would High Speed Rail work in North America?
Alan McConchie
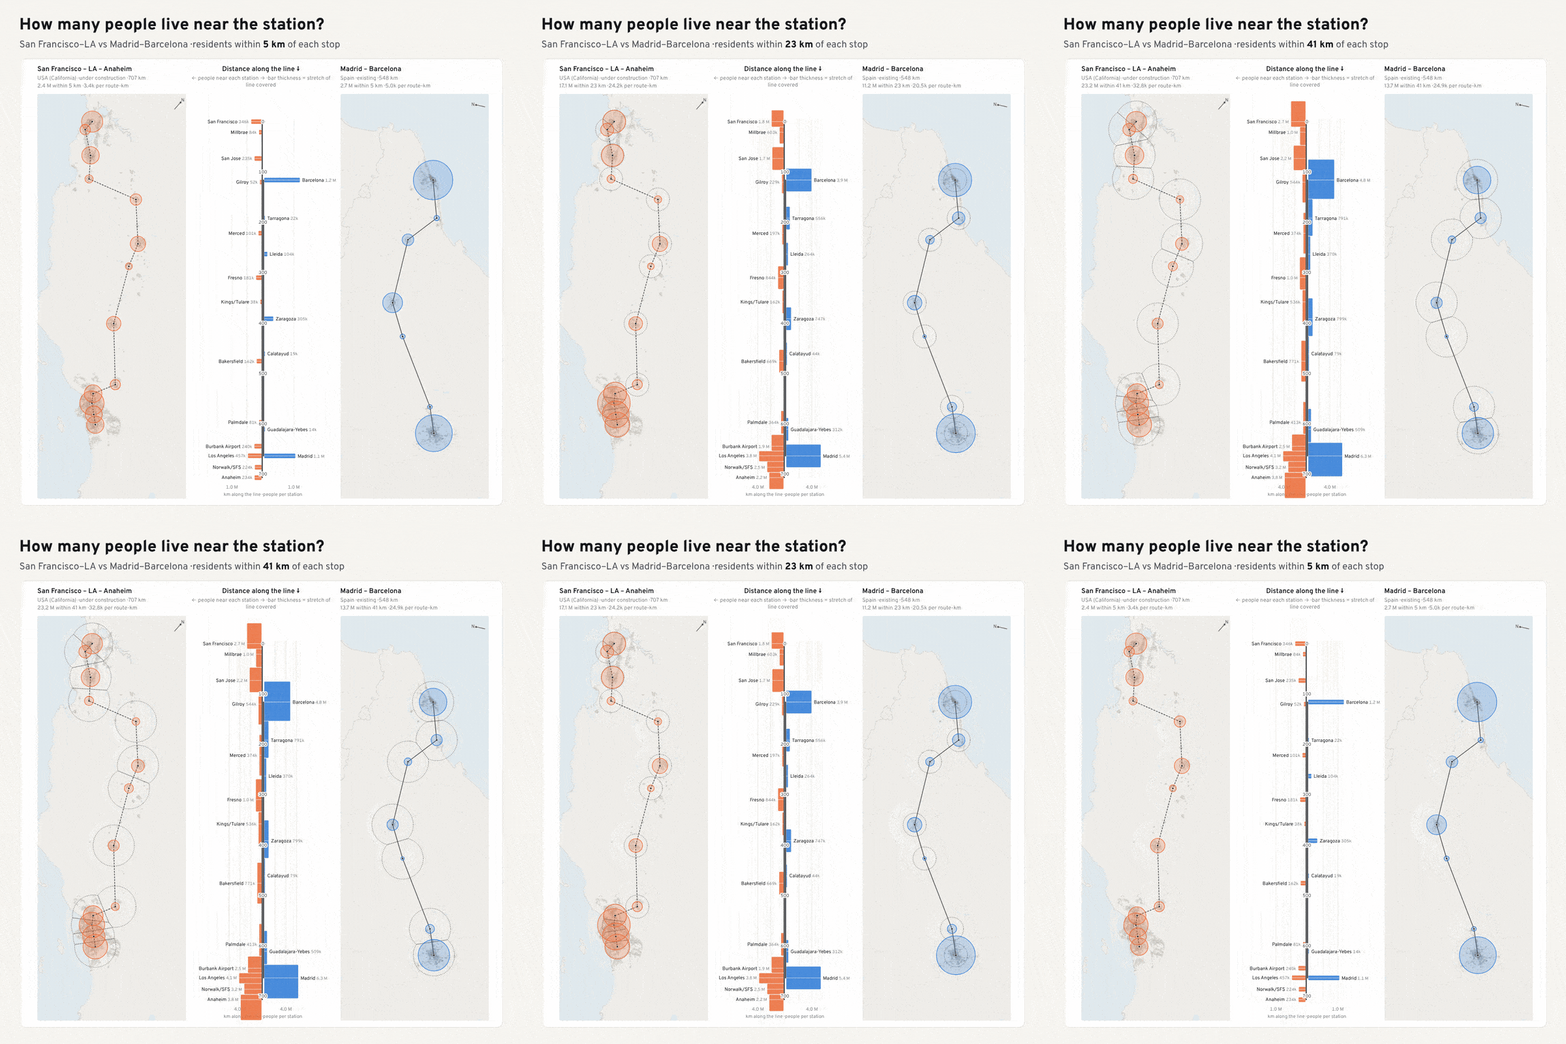
On paper, many North American city pairs look ready for high-speed rail: their metro populations and distances are comparable to Europe’s successful lines. But most North American cities are less dense, so far fewer of their residents live near the stations where the train actually stops.
To make apples-to-apples comparisons between North American route plans and European realities, I visualized 26 existing and planned corridors using the same global population grid, counting everyone within 5, 10, 20 and 50 km of every station. You can set any two corridors side by side at the same scale, and even switch to 2050 population projections.
Up next
That’s nine down and 21 to go. Topics coming up: “Prompting only”, “Sound”, “Power”, and a “Borgesian map” so detailed it becomes the territory.
Follow along on our #30DayMapChallenge page, where every new map lands as it’s posted.