
Sometimes I wish I could be as disciplined as my friends at Berg, who’ve been faithfully writing up weeknotes rain or shine for 308 weeks now. These days it’s a struggle to even participate in all the things that are going on around the studio, much less write about it. In my head sometimes we’re still just a couple guys sitting in a room smoking cigarettes and staying up until five in the morning [really]. The reality is that we’ve been up at around the ten-person mark for a couple of years now, almost half of us are women, I quit smoking 2 years ago, and these days I’m much more likely to see 5 in the morning by waking up that early than by staying up that late! In any event it’s Friday afternoon and I didn’t want to let another week go by without talking about at least some of the work that’s been going on, so:
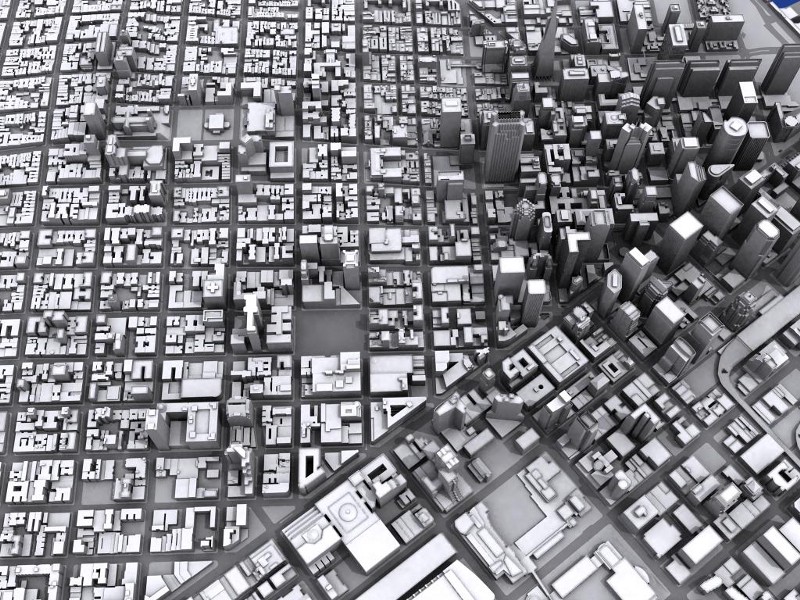
We’re doing a pile of thinking about the background tiles that are the foundation of most of the maps that people are working with on line today. There’s a ton of room to play here. For a little context, one of the earliest experiments with embedding information into these background images we did was with a model of San Francisco provided to us by SOM a while back. The first render was a fairly conventional one, a grayscale view with shadows and so forth:
In the second render, you take the block and lot number of each building, and use those to generate different colors for the buildings:
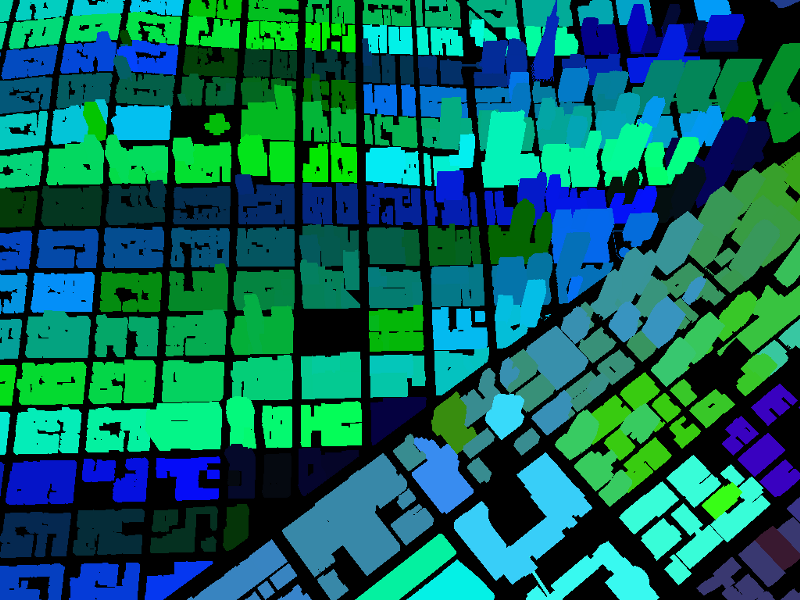
When you overlay the first (image) on top of the second (data), you can do this kind of thing:

Selectively blurring and unblurring complex shapes on the fly, in the browser. And since you know the logic you used to generate the background color from the block and lot number, you can extrapolate back out from the color to the lot number, and provide links to theCity Assessor’s records for those buildings, without having to send all that data down the wire. Which is kind of cool. We’ve used this in a couple of client projects over the years, and are currently working on a mapping project that’s going to rely on this kind of thing in a pretty big way.
I mention all of this by way of segue into the problem that starts to come up when you start wanting to do this for the whole world. It takes about 360 billion tiles to cover the whole world down to zoom level 20. Which is alot, especially considering that most of them are in the ocean.
So here are some lovely things that Aaron’s been working on, in part to find a way to more easily limit the areas that the tiles have to get drawn for:
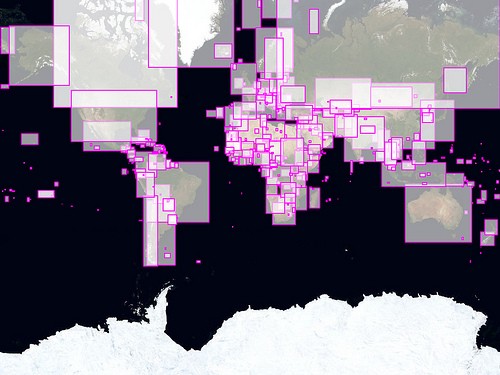
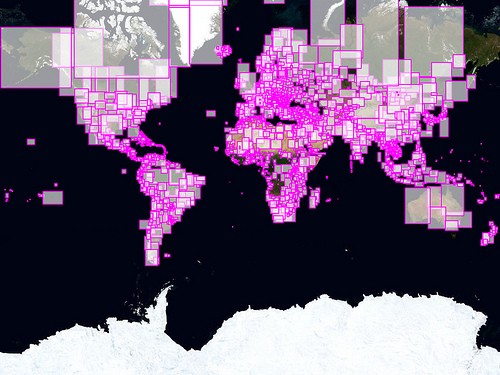
Each continent gets a set number of discontinuous shapes that it’s allowed to be made up of, and depending on the number of those that are allowed (the second image allows alot more than the first), you can start to generate coastlines that designate areas where you probably don’t need to render tiles at very zoomed in levels. Plus, as is usual with Aaron’s stuff, it’s fun to look at.