
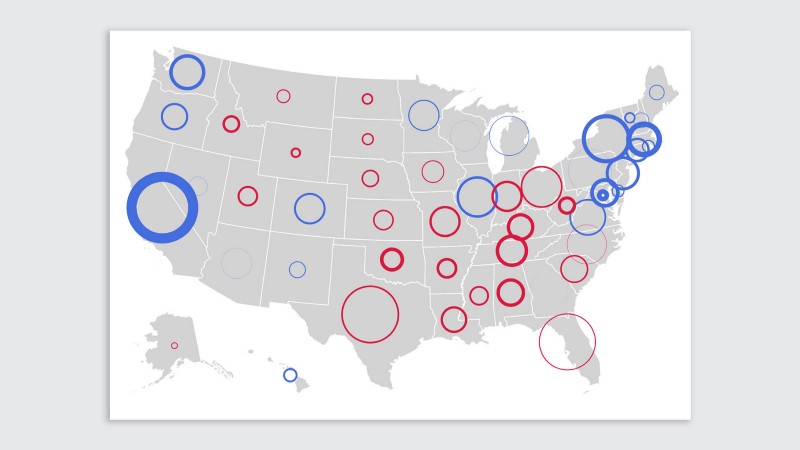
The Election Ring Map sneaks into Ken Field’s new “Thematic Mapping” textbook
Last November, as part of Stamen’s 2020 roundup of presidential election maps (“We design maps for a living. Here’s who got the 2020 election right“) published in Fast Company, I sketched out the idea for a new kind of election map which I hadn’t seen implemented before. The map shows a colored ring for each...
Our Brilliant Friend: Stamen and OpenStreetMap through the years, part 2
A personal history of OpenStreetMap, seen through the eyes of Stamen Design by Alan McConchie, Eric Rodenbeck, and the Stamen Design team Recap In part one of this series, we covered the early years of the friendship between Stamen Design and OpenStreetMap. Like Bert and Ernie, Romy and Michele, or Turner and Hooch, these two...
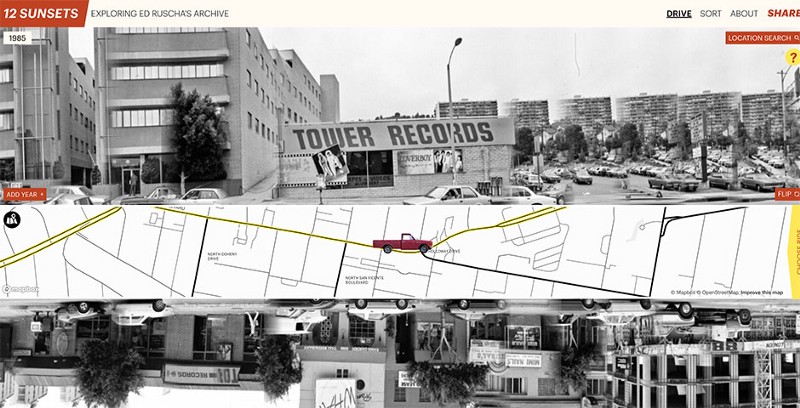
Stamen’s 12 Sunsets with the Getty Museum wins Webby Award!
Stamen’s project 12 Sunsets: Exploring Ed Ruscha’s Archive, which we built in collaboration with The Getty Museum, is the 2021 Webby Award winner in the category of Architecture, Art & Design! The Webby Awards have honored the best websites on the internet every year since the inaugural awards in 1996. This year’s awards ceremony was...
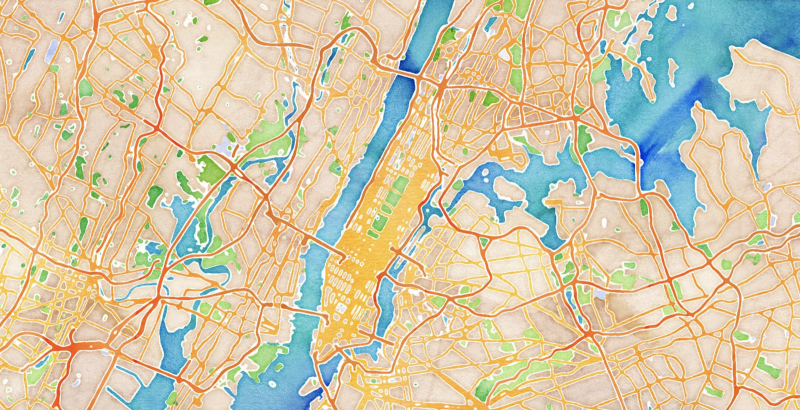
Stamen’s Watercolor map tiles are now in the Smithsonian’s permanent collection!
Stamen’s Watercolor map Today the Cooper Hewitt (the Smithsonian Design Museum) officially added Stamen’s OpenStreetMap-based Watercolor map to its collection, the first live website to ever become part of the Smithsonian. Learn more from the Cooper Hewitt press release and the announcement event recorded on YouTube: We are especially grateful to the hundreds of thousands...
Our Brilliant Friend: Stamen and OpenStreetMap through the years, part 1
A personal history of OpenStreetMap, seen through the eyes of Stamen Design by Alan McConchie, Eric Rodenbeck, and the Stamen Design team Stamen and OpenStreetMap, growing up together on the mean streets of Napoli Last month, we were interviewed by Steven Feldman for The Geomob Podcast about Stamen’s history using OpenStreetMap (OSM). This stimulating conversation...
Stamen Design on the Geomob Podcast
Recently Eric Rodenbeck and Alan McConchie had a fascinating conversation with Steven Feldman for the Geomob Podcast. Geomob is a great resource for the geospatial community, organizing a series of in-person meetups in Europe (and now hosting virtual presentations which are all recorded online and available on YouTube). In our audio interview with Steven we...
Corona-cartography: what we learned from a year of COVID-19 maps
In our last post looking back at the data visualization trends of the coronavirus pandemic, we focused mainly on charts and diagrams, and less on maps and cartography. By and large, the maps of the pandemic were predictable and familiar choropleths and proportional dot maps that did their jobs well and didn’t call attention to...
Visualizing the pulse of a pandemic: A year of COVID line charts
Visualizing the pulse of a pandemic: A year of COVID line charts You asked, we answered: The @FinancialTimes coronavirus death & case trajectory trackers are now 🔥 FREE TO READ 🔥 outside the paywall: https://t.co/JxVd2cG7KI In this morning’s update, the US has gone above 470 deaths, bringing it just behind where Iran was at the...