A collection of all blog posts by Alec Burch.

blog/Alec Burch

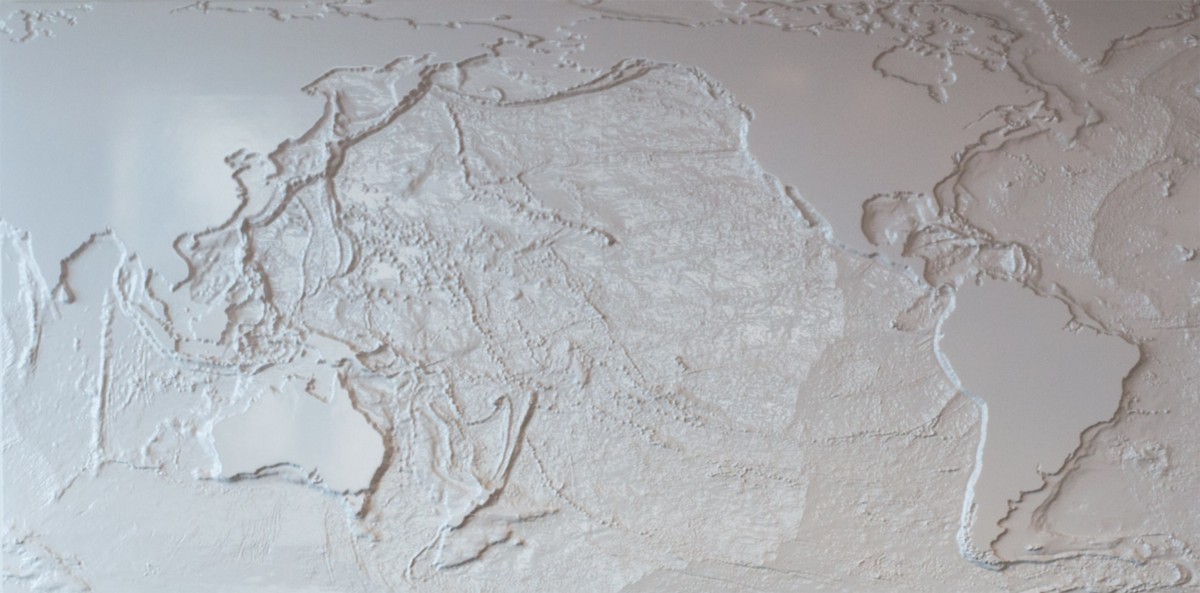
Cartographers Play Video Games – A Review of the Map in The Legend of Zelda: Breath of the Wild

Alec Burch | 05.08.23

At Stamen, our appreciation and opinions of maps go beyond just our professional work here and often bleed over into our personal interests as well. Our eye for interactivity, color palettes, contour lines, and labels doesn’t stop once we log off at the end of the day. As we covered in a previous post by...

How we use collaborative design software to collaborate on more than just design

Alec Burch | 03.23.23

If you had the opportunity to visit the Stamen studio during our twenty-year reign at the corner of 16th and Mission you’ve probably noticed how integral collaboration is to the fabric of our business. Project teams huddled in a meeting room, whiteboard sketches happening in another, spontaneous hallway conversations, or our daily meals together around...

Visualizing Global Immunization Rates with The World Health Org, 2019

Alec Burch | 08.19.19

We at Stamen have had the pleasure of working with the World Health Organization’s Department of Immunization, Vaccines, and Biologicals going back to 2015. Annually we have helped them to develop their report of global vaccination rates (you can see previous work here: 2016, 2017). The following post highlights some of the key findings from...

Making a 32ft wide mural for SPUR

Alec Burch | 02.22.18

We keep finding ourselves here. Last time I published an article I spoke about how I went about creating a 3D cut map for Matson’s office in Oakland with Stamen. In this post I’ll outline what it took to make a 32′x10′ high res satellite image (that’s 13,824,000 pixels) for SPUR’s office in SOMA. SPUR...

Creating a giant 3D bathymetric map, out of 2D data, for Matson

Alec Burch | 09.05.17

Sometimes at Stamen we get the chance to create physical works of data visualization for our clients in the tactile world. Matson recently commissioned us to create an anchoring art piece for the boardroom at their recently redesigned offices in Oakland, CA. You may recognize the name from their logo on the side of shipping...

Visualizing infant vaccination rates for the World Health Organization

Alec Burch | 07.27.17

Eric Rodenbeck interviews Kai Chang and Alec Burch about their latest work with the World Health Organization Eric Rodenbeck, Kai Chang, & Alec Burch Eric Rodenbeck: I’m here with Kai Chang and Alec Burch. We’re here talking about our most recent work with the World Health Organization. We’ve worked with them before. Kai Chang: We...

All the Stamen data visualization history you can handle, now on Medium!

Alec Burch | 08.15.16

Stamen has been working on data visualization projects for 15 years(!)  –  with nine years of blog posts on our work…scattered across a potpourri of blogging platforms. As of today, all our posts from yesteryear have been migrated over to our Medium publication, Hi.Stamen.com. We hope you’ll enjoy looking back at some of our work...

Sightlines Project: Visualizing Living Well in 21st-Century America

Alec Burch | 02.19.16

We’ve been working with the Stanford Center on Longevity at Stanford University to bring to life their Sightlines Project. Stamen’s role was to review data from eight nationally representative, multi-year studies that involved more than 1.2 million Americans over the last 15 years and to visualize that data in an appealing and informative way. Sightlines...