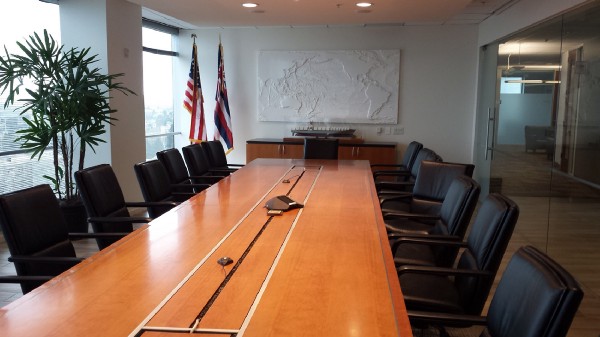
Sometimes at Stamen we get the chance to create physical works of data visualization for our clients in the tactile world. Matson recently commissioned us to create an anchoring art piece for the boardroom at their recently redesigned offices in Oakland, CA. You may recognize the name from their logo on the side of shipping containers.
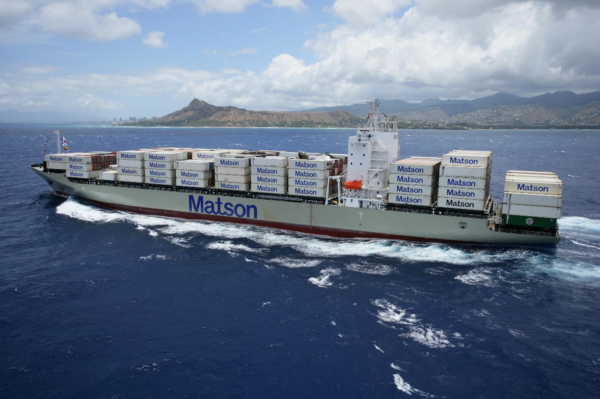
If you haven’t heard of them before, Matson is a leading shipping company founded in San Francisco in 1882 and now headquartered in Honolulu and with operations spanning the Pacific, from Anchorage to Auckland, Shanghai to LA. Matson’s history is pretty fascinating — which includes introducing containerization to the Pacific shipping industry. Hawaii is deeply embedded in the history of the company and for this reason they wanted a piece that communicated its importance, while still showing the full range of Matson’s Pacific network.
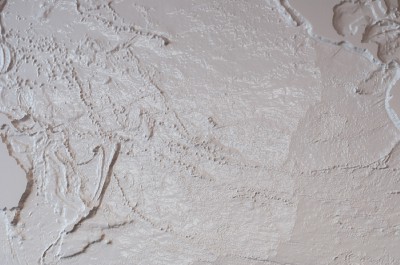
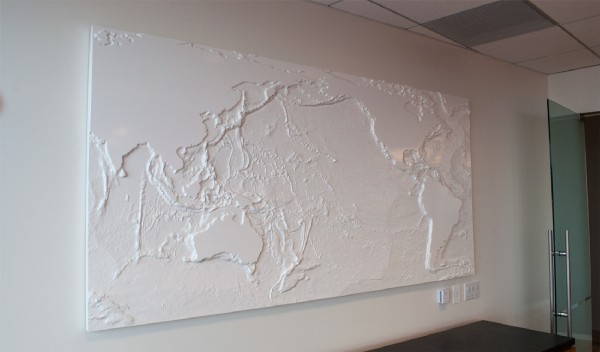
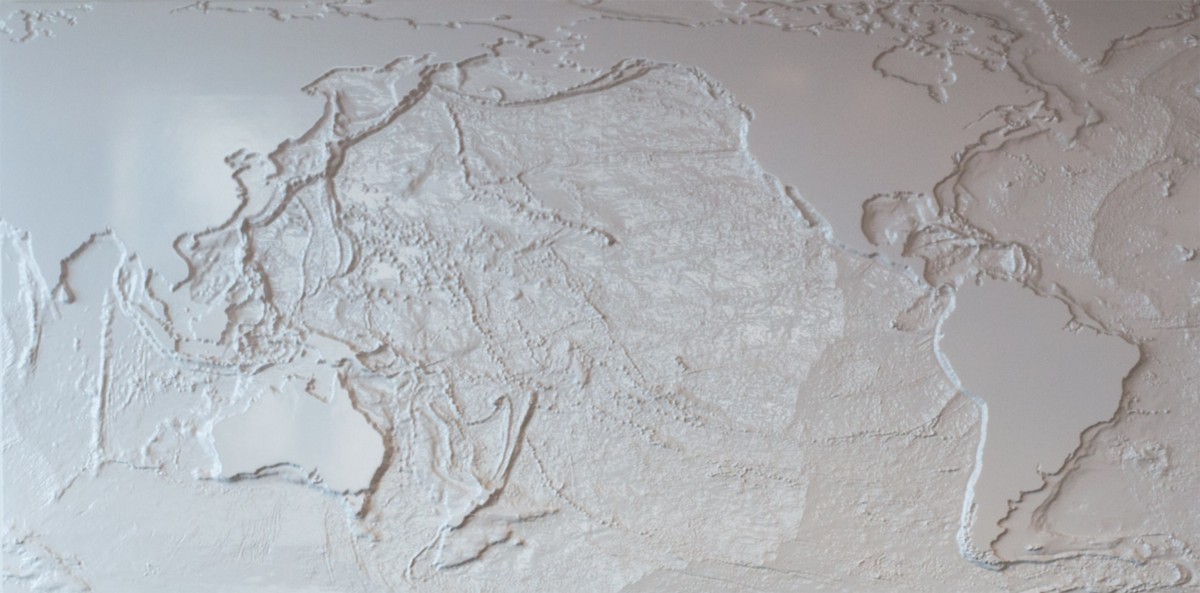
What we ended up creating is an 8′ x 4′ all-white 3D bathymetric map, that places our 50th state smack in the middle. We also decided to do a bit of an unusual crop (sorry Europe, Africa, Antarctica) to focus on Matson’s territory, the Pacific.
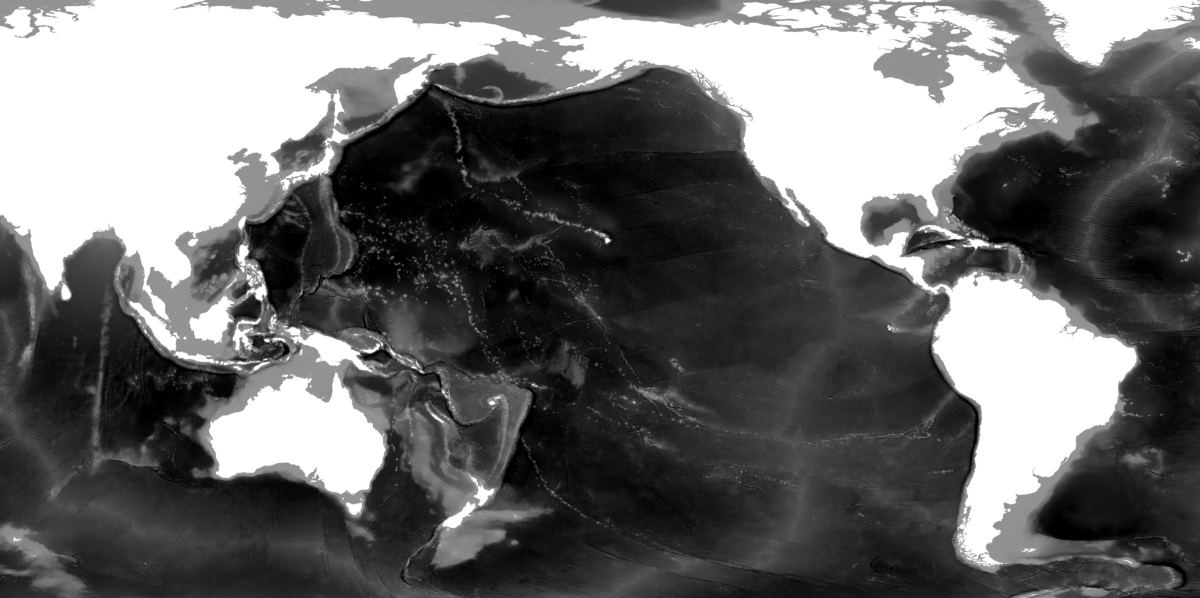
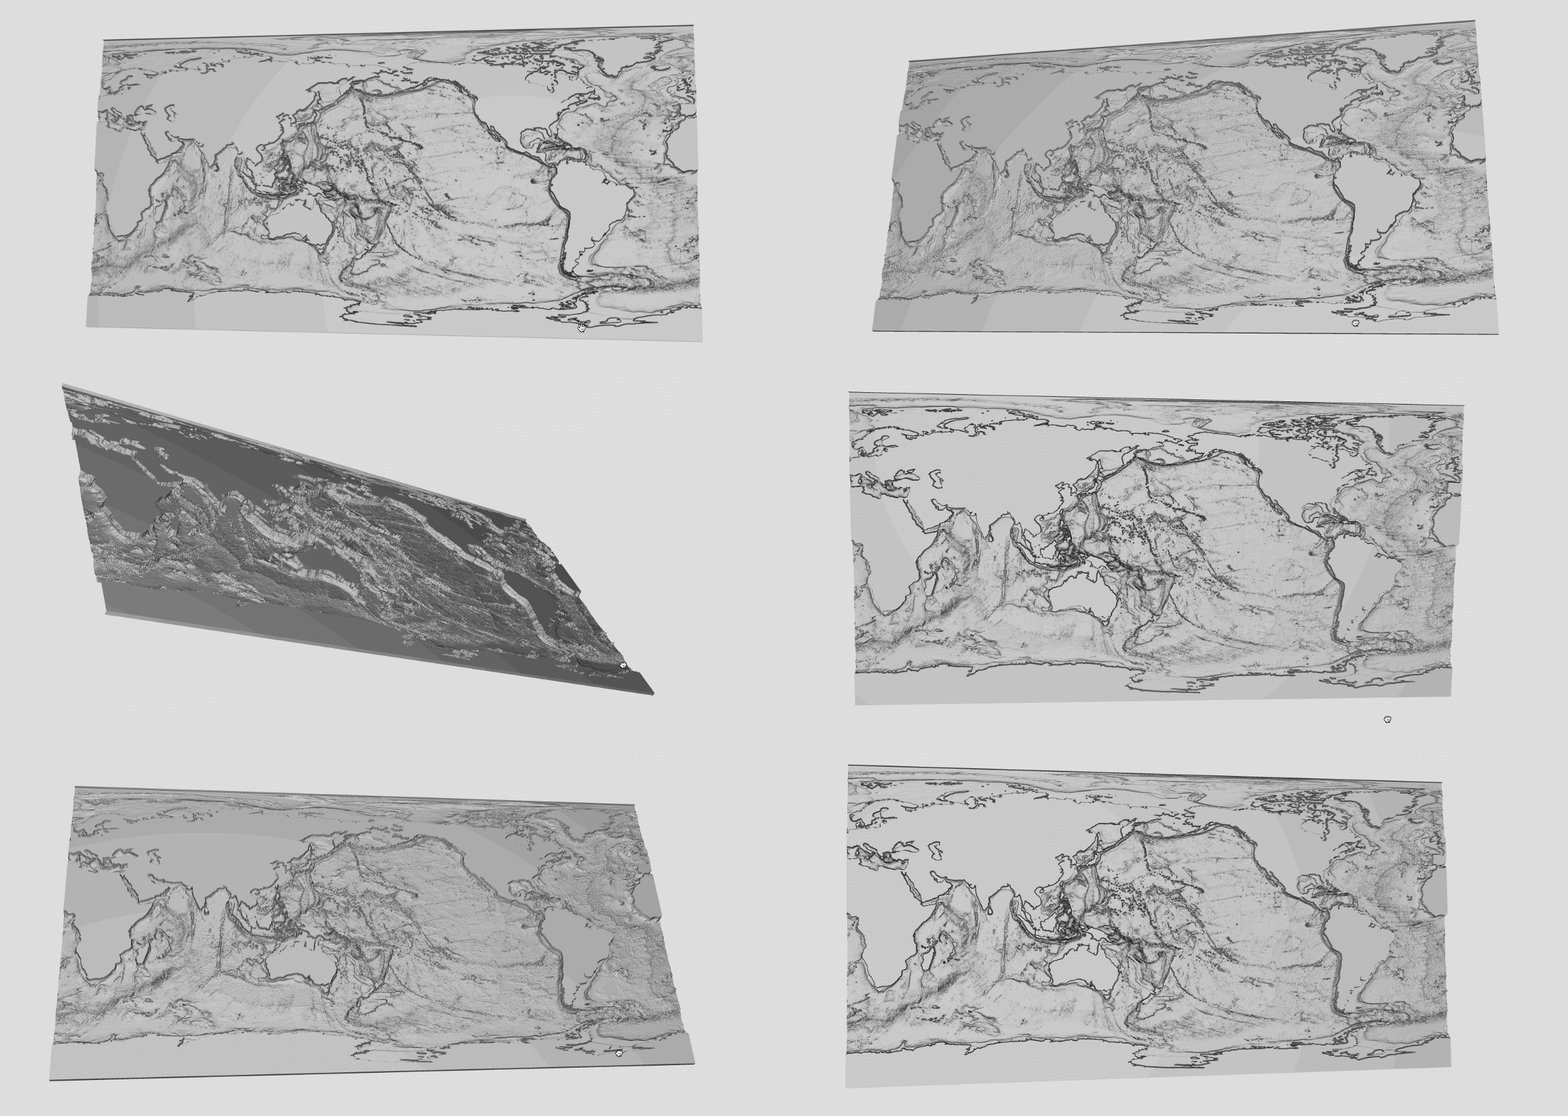
For creating the 3D file that would eventually be sent to a CNC, we followed Peter Richardson’s guide that can be found here. You’ll need to generate a heightmap which means elevation is represented in grayscale on the map. The sources of our heightmap is the one place we diverged from Peter’s guide. Instead of using Heightmapper to generate a topographic map we used CleanTOPO2 to create a bathymetric map (the measurement of the depth of water).
CleanTOPO2 is a convenient, clean (as the name implies), ready-to-go dataset, but we had to make one little modification: because the final 3D product was going to be painted all one color, there would be no way to tell what parts of the map are land, and which are water. This may sound confusing at first; obviously, land is higher up, and the underwater parts are lower down, right? True, but it’s not quite that simple. Here’s what the original CleanTOPO2 data looks like, with no colors indicating land or water, it’s just raw elevation:
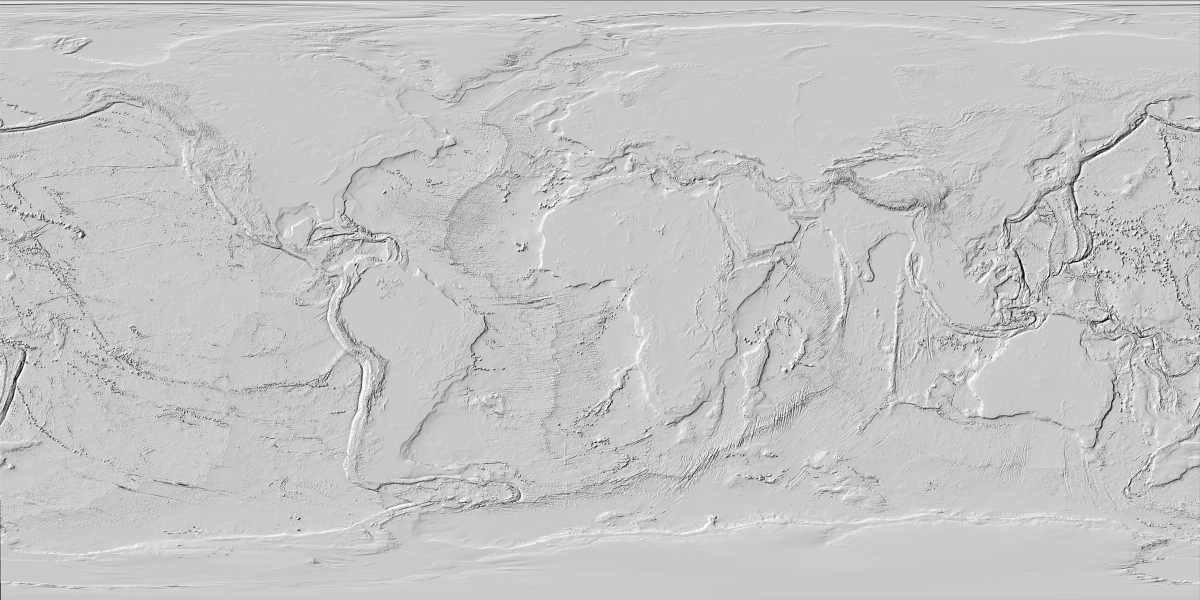
If you look closely at places like Florida, Northern Europe, or Southeast Asia, you’ll find it hard to recognize any familiar coastlines. That’s because in those areas the land is very flat, and the offshore continental shelf is very shallow.
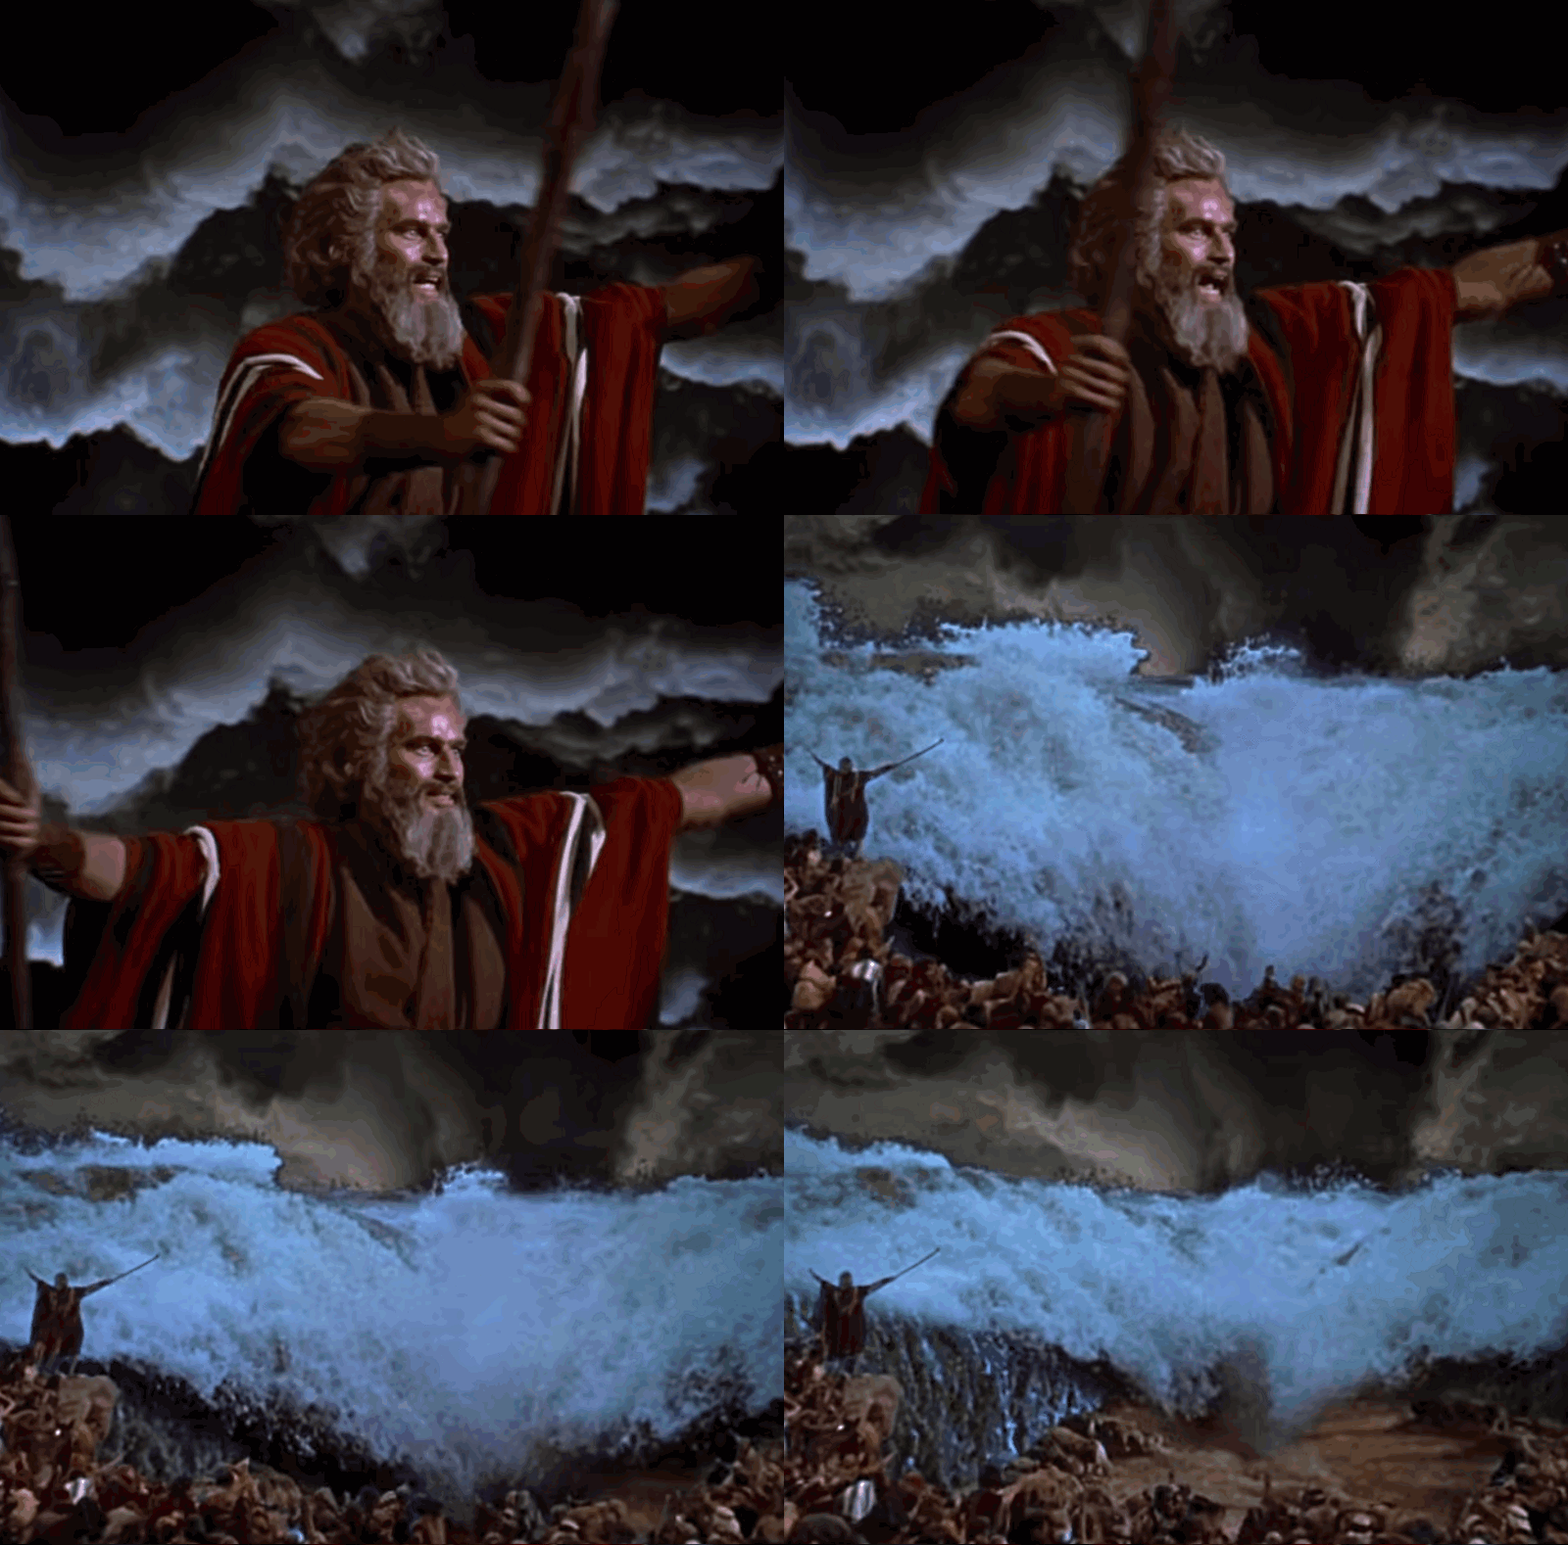
So, to make the coastlines more visible (and to keep the emphasis on the oceans, not the land) we took a few liberties with the data. Basically, we flattened the land (no more mountains) and extruded the all the land areas upward by about 2 kilometers. This “parting of the oceans” gives us a nice dramatic cliff all along the coastlines of the world.
Once we had our heightmap we used Blender (a free 3D software) to translate the gradations to depth along the z-axis. The end result is a 3D map that you can either send to a CNC like we did or to a 3D printer. (This is all outlined in Peter’s guide above.)
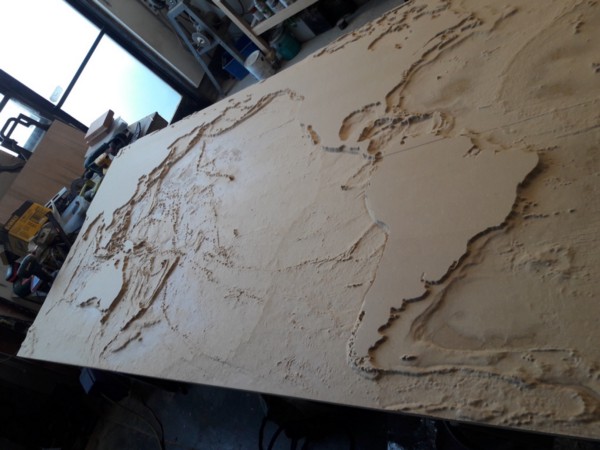
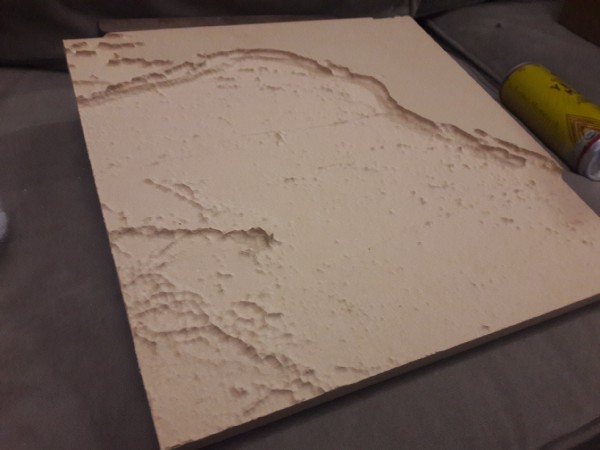
After we had the 3D file in hand we worked with the guys at SoulMind Studios to carve the map out of an 8 ‘x 4’ sheet of MDF. It took some tweaking to get things just right but eventually we arrived at a map that was worthy of painting. Baumer Finishing handled the painting to achieve a pretty remarkable high gloss finish.
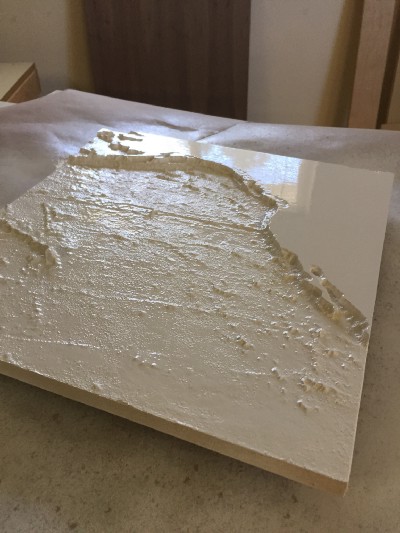
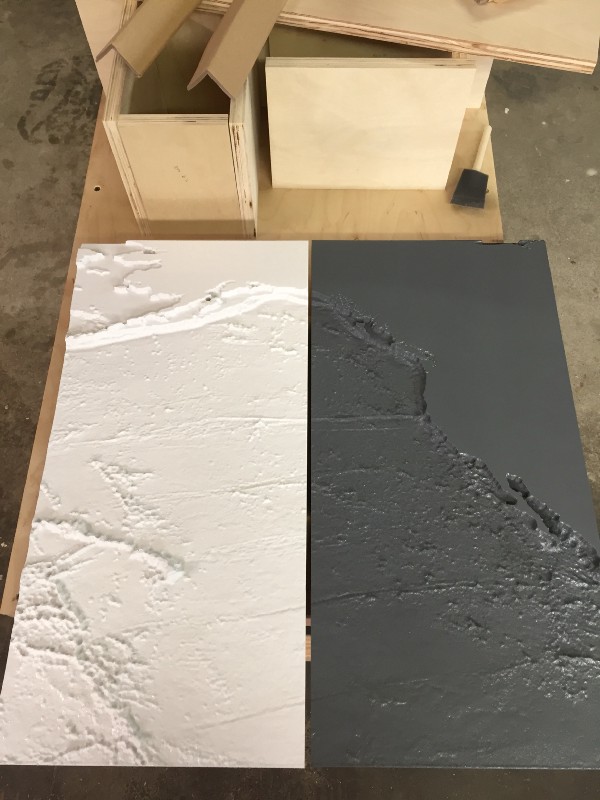
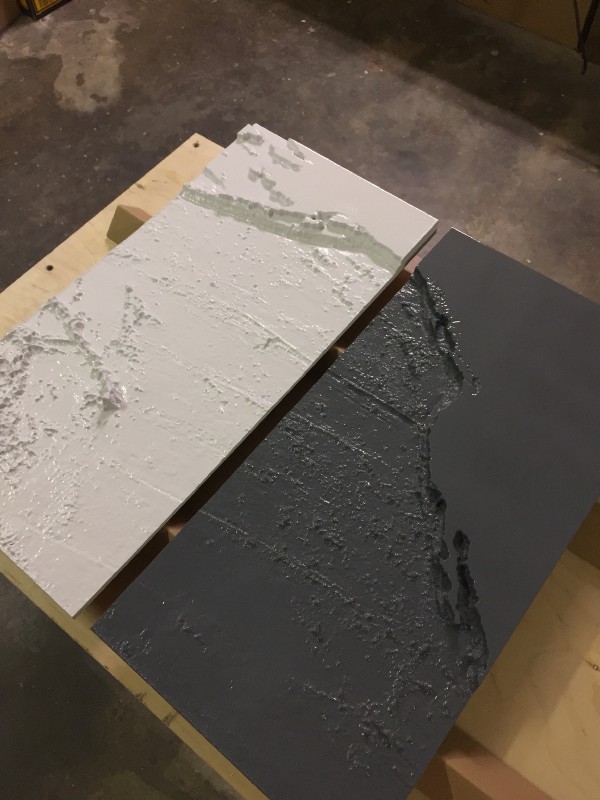
We were thrilled with how the map turned out. The map hangs on the wall of the Matson boardroom over in Oakland, a place we hope it is enjoyed for many years.
Thanks to Erik at SoulMind Studios and Steve at Baumer Finishing for collaborating with us on this, and to Matson for bringing us the project (…and to David Rumsey for sending them our way)!

