
[Also posted on Fast Company as “We design maps for a living. Here’s who got the 2020 election right”]
Every election season, maps and charts take center stage on major news outlets and across social media. The public is hungry for numbers and understanding, and data visualizers and cartographers race to produce their best work under tight deadlines, adapting familiar tropes to keep up with unpredictable and fast-moving developments.
As a cartography and data visualization studio (you may know our work from our open source basemaps at maps.stamen.com, or our more recent projects visualizing the possibilities of electrifying America’s households, exploring changes in mobility during the COVID-19 pandemic, or mapping the impacts of climate change on bird migrations with the Audubon Society) at Stamen Design we follow along with the election map deluge with particular interest. We’re constantly sharing election maps and charts in our internal Slack group, discussing which ones are our favorites, and also closely watching which ones seem to get the most attention in the public. As you can imagine… we have opinions.
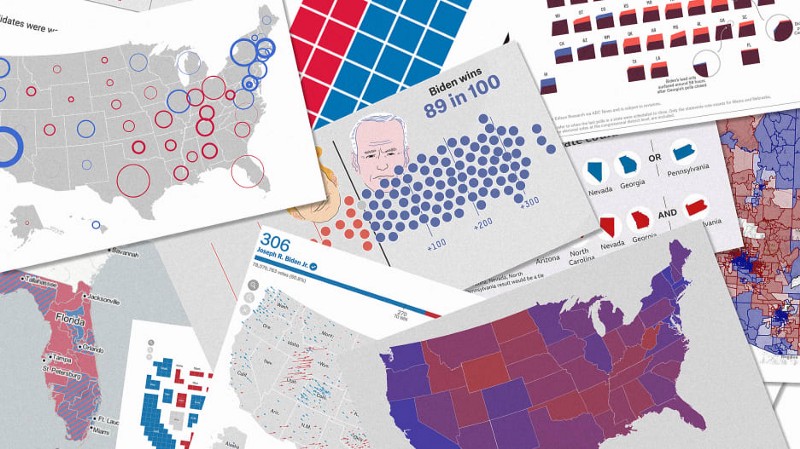
Here are some of our favorite charts and maps from the 2020 election.
Before election night:
We were asked by Fast Company for our favorite election visualizations… and we said FiveThirtyEight. We still think FiveThirtyEight is at the top of their game, especially for data-literate analysis in the lead-up to an election. In 2016, the public at large felt burned by the polling errors and incorrect predictions by most of the pundits, but we’d like to point out that FiveThirtyEight’s model (predicting Clinton with less than a 3 in 4 chance of winning) was much “less wrong” all the other high-profile models, some of which gave Hillary a 99% chance!
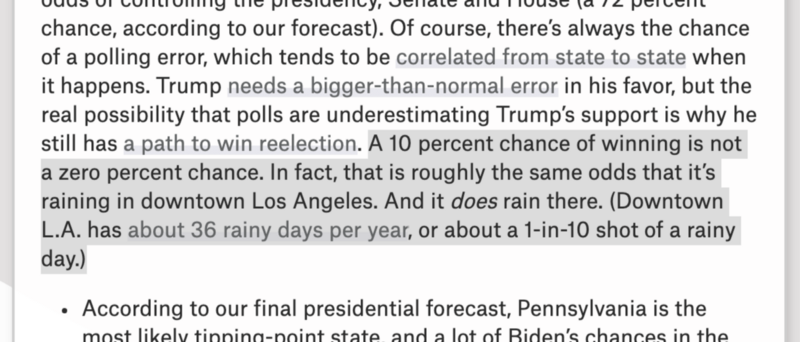
We loved how FiveThirtyEight learned from the public reaction in 2016 and put more effort into their forecast to better explain uncertainty and how probabilities work. For example, their projection for this year (only a 10% chance of a Trump win) was even more confident than 2016, but they took extra care to explain in plain language that even a 1 in 10 chance is still something that can happen quite often:
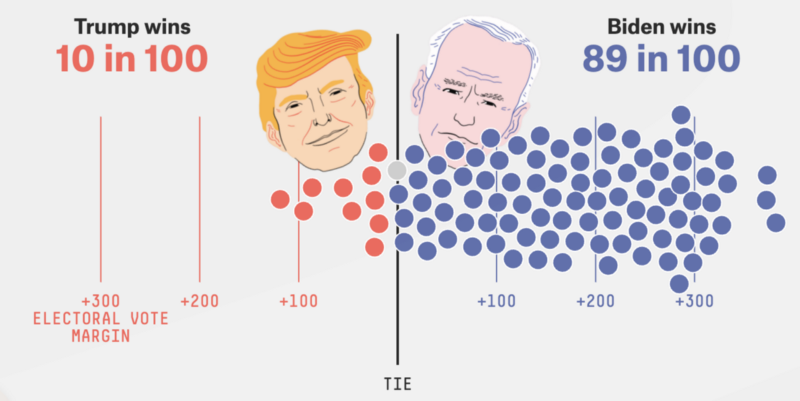
Their “beeswarm” chart was perhaps the first iconic visualization of this election season, becoming such a dataviz staple that one data visualizer made it into a Halloween costume.
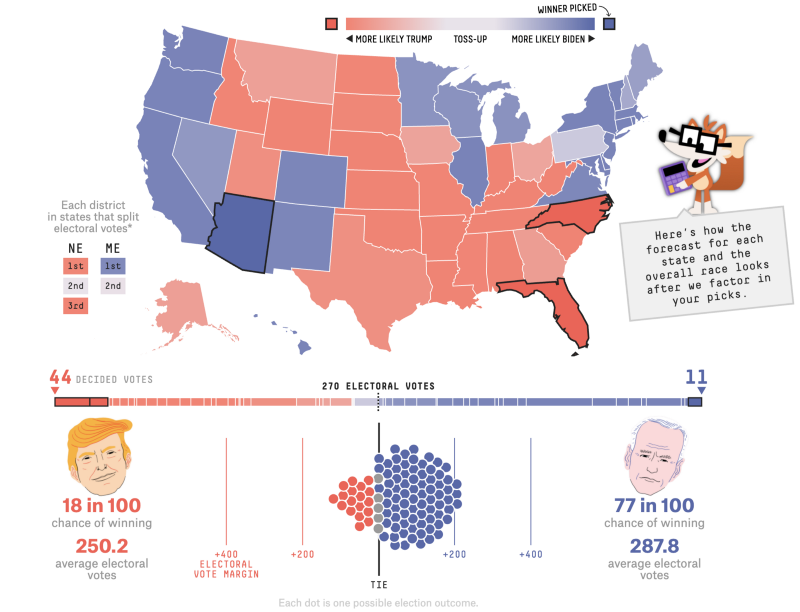
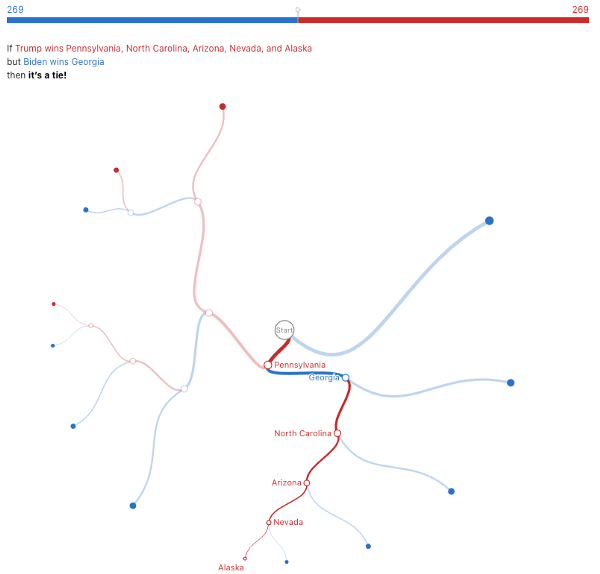
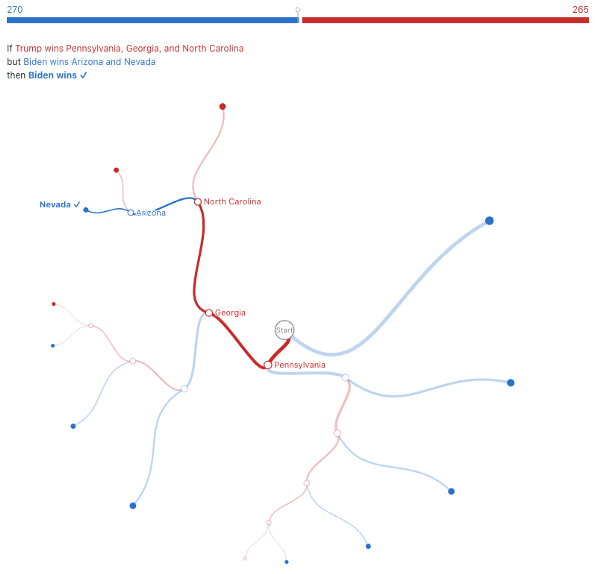
As we approached election night, we liked the interactive model which lets you pick winners in specific states and then see the probabilities for the other states update dynamically:
This tool for playing with different scenarios also reminds us of the classic New York Times “Paths to the White House” visualization from 2012 and this 2020 version from Kerry Rodden, the Electoral College decision tree:
On election night:
On election night we watched some friends and colleagues live-streaming some data visualization as the results came in. Ian Johnson and EJ Fox did a two hour broadcast (recorded on twitch) mixing a live feed of TV news with their own data visualizations.
The following day, Shirley Wu live-streamed some chill co-working and visualization of voting problems on election day.
And for live updates during the election count, we were all curious what would be the loved-or-hated visualization of 2020 like The Needle from the New York Times was in 2016. Everyone was traumatized by the stressful shaking needle, but we still need some way to show uncertainty. The Washington Post tried making bar charts (showing the votes that have been counted so far) supplemented by a blurry zone to the right of the bar, showing where the final result is likely to end up, based on the expected demographics of the votes still waiting to be counted. Perhaps this “Fuzzy Bar” would be the famous viz to come out of this year?
Oh yes, people loved it:
Although others found it a bit obtuse:
(this will certainly be a phrase repeated in the Stamen studio many times in the future)
Charting the days that followed:
After the first night of election results was over and most of the state races had been called, we settled in for several more days of vote counting in a few key states. The dynamic “choose your own adventure” maps and scenario modeling tools became much less useful, and the landscape of the remaining Electoral College outcomes could be explained much better without a map or a chart at all. Simple infographics like this one from the BBC did an excellent job of telling the reader all they needed to know:
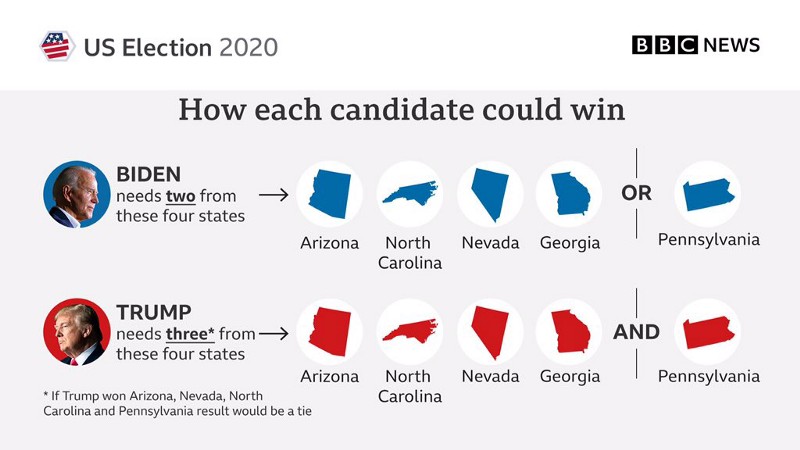
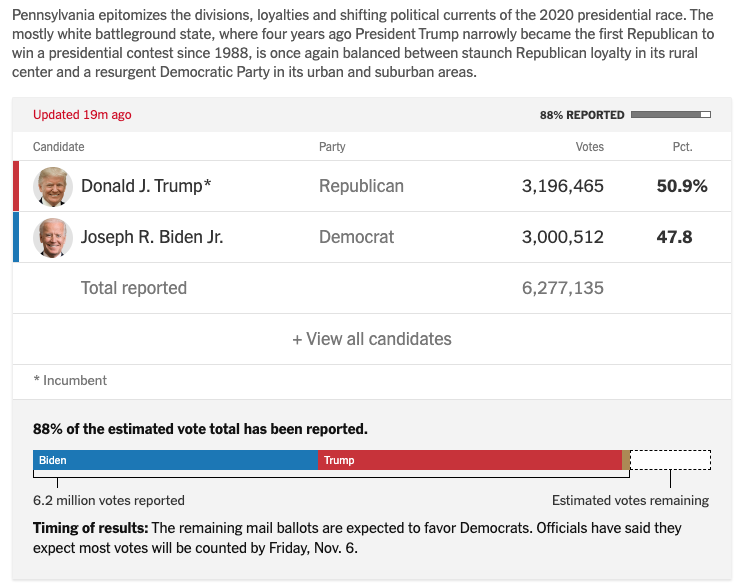
So, for days, all eyes were on these five states, watching as the final votes were counted with agonizing slowness.
Little did we know (okay, we should have known) that the star visualizations of 2020 would be variations on line charts showing the change in vote margins as votes were tallied. This year there were far more mail-in ballots than ever before, and these would take days to count. Showing partial results was the name of the game, which was quite different from years past.
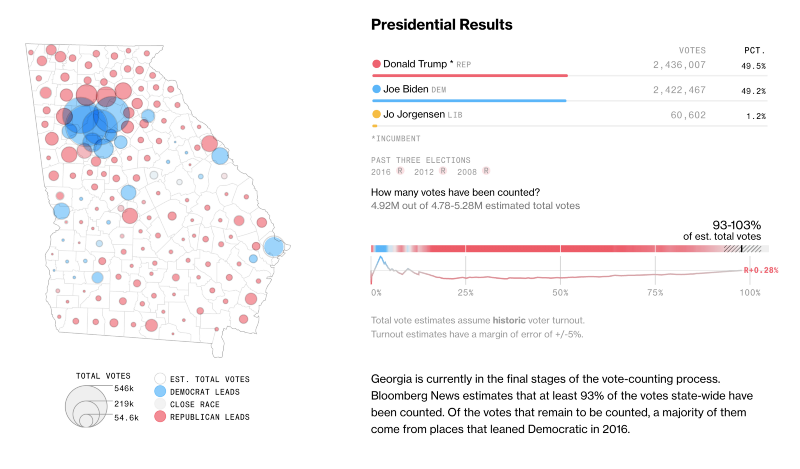
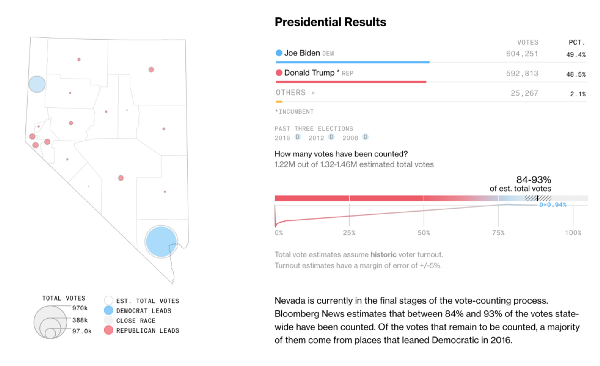
We particularly liked the design of the Bloomberg visualizations, combining a soft color gradient with a line chart to show the shift in the lead as a greater percentage of votes came in:
Here’s another Bloomberg variation on those nice soft color gradients, almost as if they were trails left by a group of snails crawling slowly to a finish line.
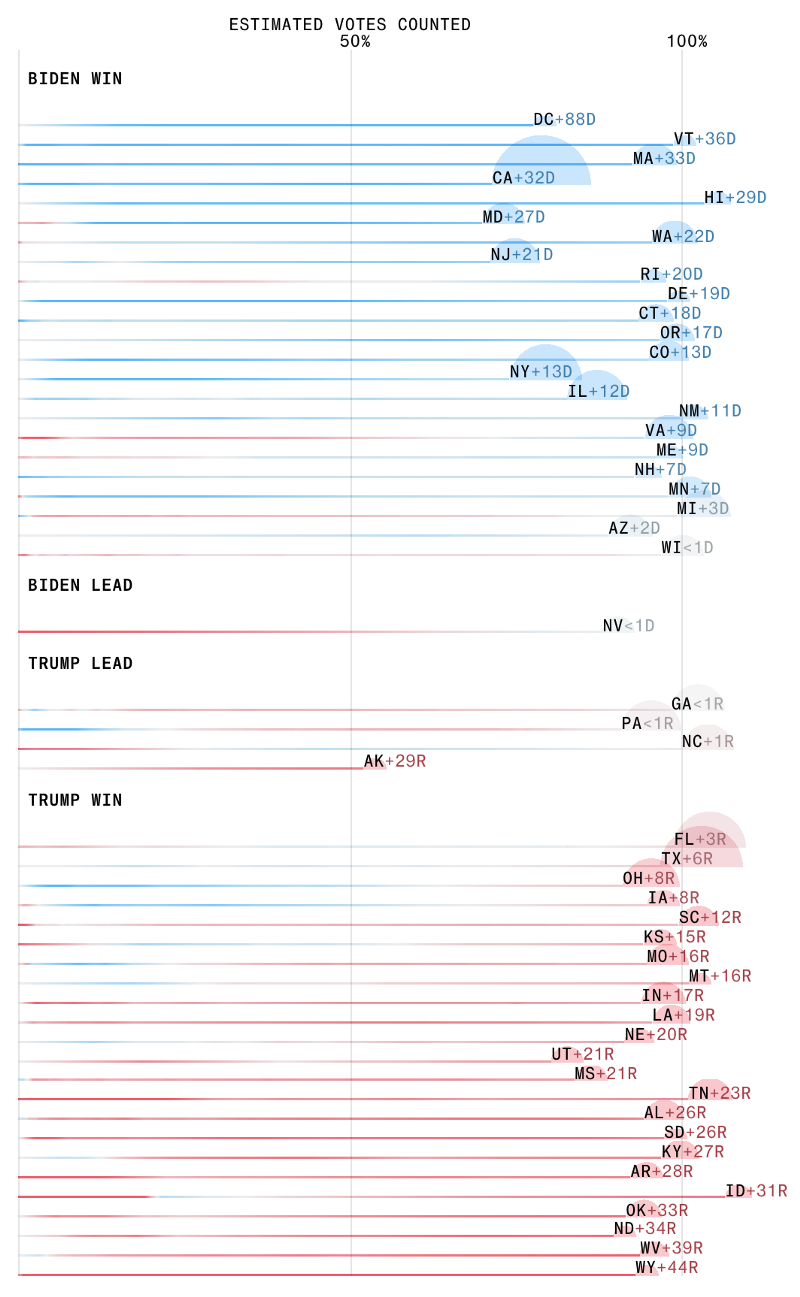
The New York Times had a similar set of visualizations which we also liked. Similar takes on the same concepts: what are the margins over time, and how many estimated votes are likely to come in?
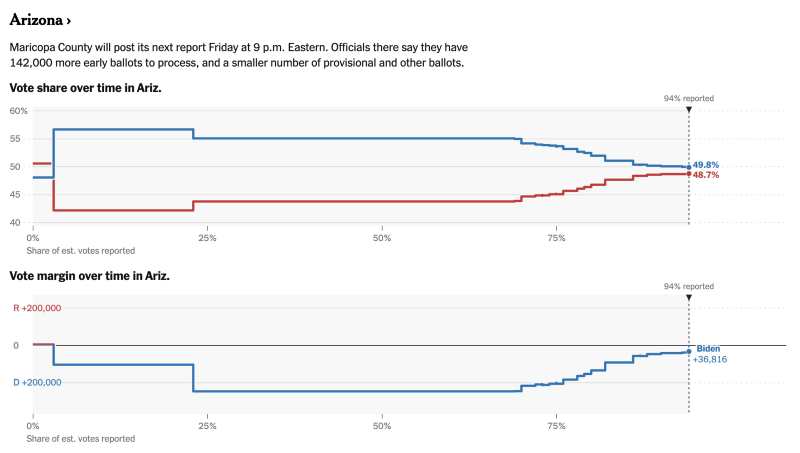
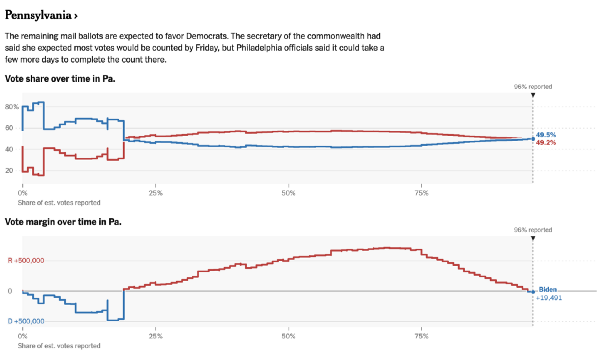
As we watched these charts, we all became amateur election Decision Desks trying to figure out when the patterns were clear enough to be confident in results before all the votes were in. We don’t know exactly how the big networks’ decision desks do their analysis, but we know roughly that they are carefully studying the trends, and when they are very confident as to where the trend lines will land, then they can call the election. As the viewer this year, we got to see those trend lines ourselves, and try to answer the same questions. How many votes might be left? What percentage of the remaining votes does Biden need to overtake Trump?
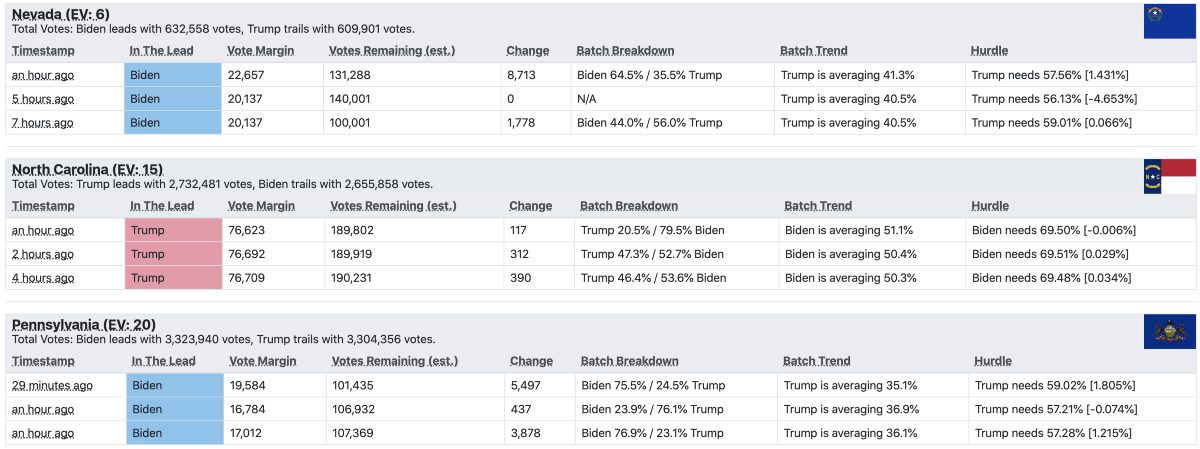
A new trend this year was people using the New York Times data feed to develop their own visualizations. This allowed people to develop visualizations that answer the particular questions they have about the data. One popular site based on the Times feed was a live-updating spreadsheet showing precisely the “hurdle” that needed to be met:
And someone else built a visualization of that scraper feed:
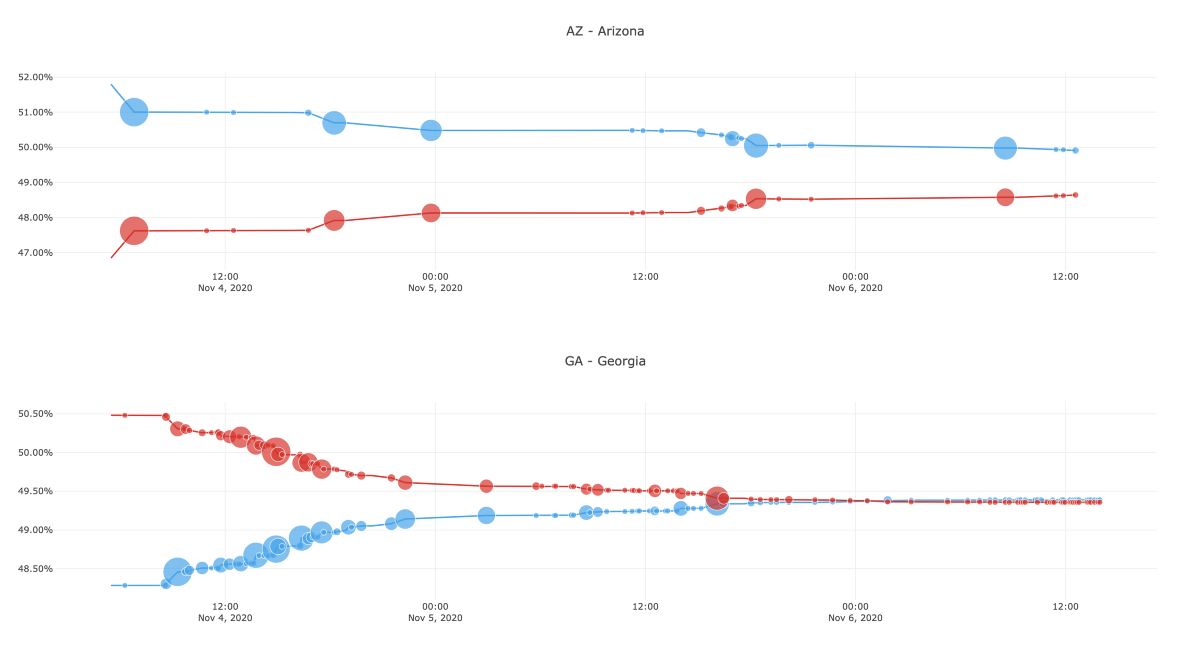
But knowing when the lead would flip would take a scatterplot and a trendline:
All of these attempts to chart the trend lines were great, but we didn’t see any of them that did a good job illustrating that the trend lines would be different for each batch of ballots depending on their sources (early mail-in ballots vs “late early” ballots mailed just before election day) or different geographies (rural areas vs big cities). Watching the live TV analysts describe the vote count, we heard a lot of good verbal explanations about why certain batches of votes were trending specific ways, but so far nobody seems to have put that successfully into a chart.
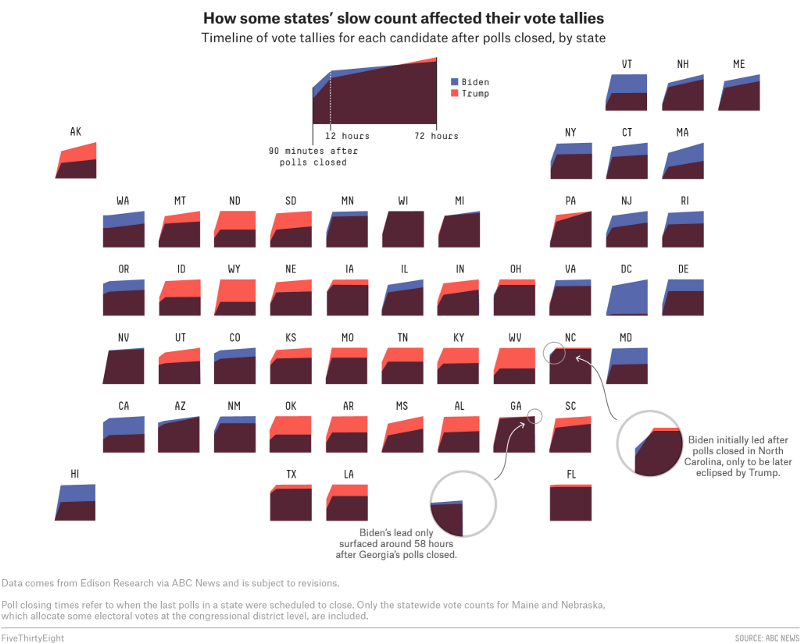
A few days ago FiveThirtyEight made a nice map-of-charts to explain the “Red Mirage” and “Blue Shift” as it played out differently in each state. We especially like the annotations on this chart:
Mapping the big picture:
Laura Bliss at MapLab calls election time “A Mapmakers’ Superbowl”, and like the superbowl, sometimes it felt like watching TV sportscasters:
Who are we to complain when once every four years all of TV becomes the “map show” and when everyone on social media (led by comedian Leslie Jones) has developed a collective crush on Steve Kornacki? (Although you likely won’t catch any of us at Stamen using the hashtag #mapdaddy)
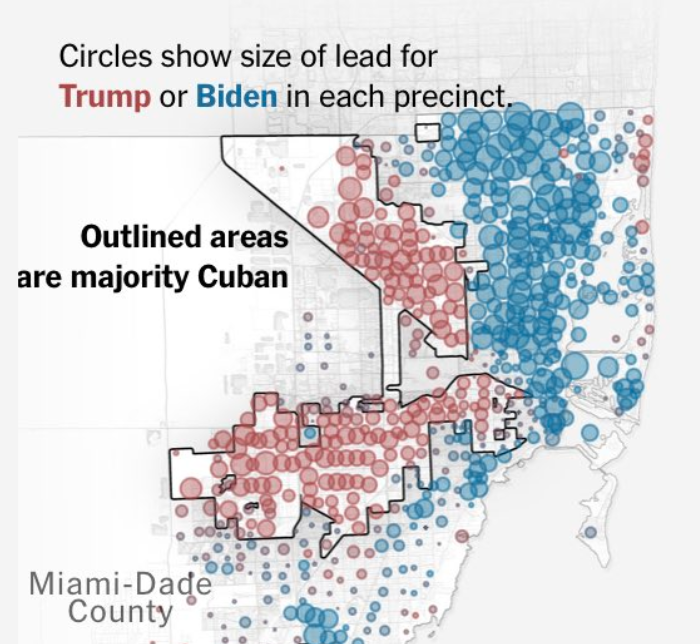
But actual map-based explanations (rather than endless geographical anecdotes from the TV talking heads) felt few and far between. Telling the story about an election is arguably more about the charts and the numbers than the maps. Only occasionally were there clearly mappable geographic patterns (like Cuban-majority census tracts) that had obvious correlation with election results:
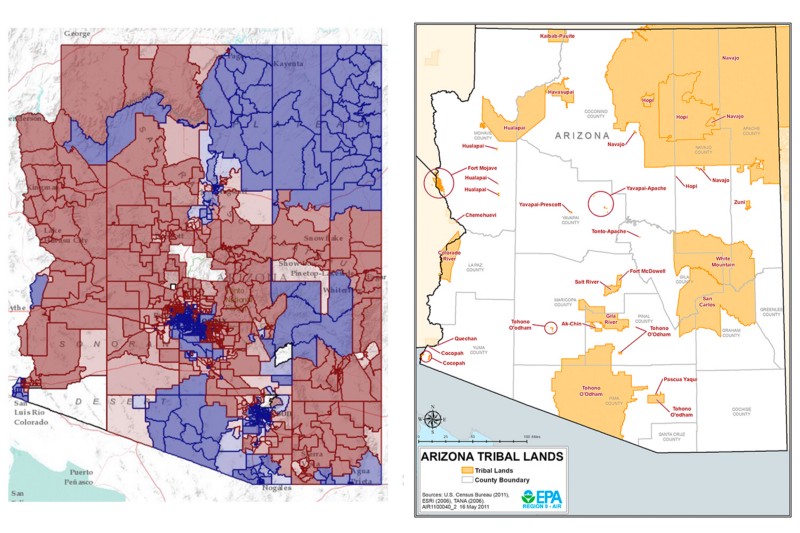
Or this example showing correlation of election results and tribal lands in Arizona:
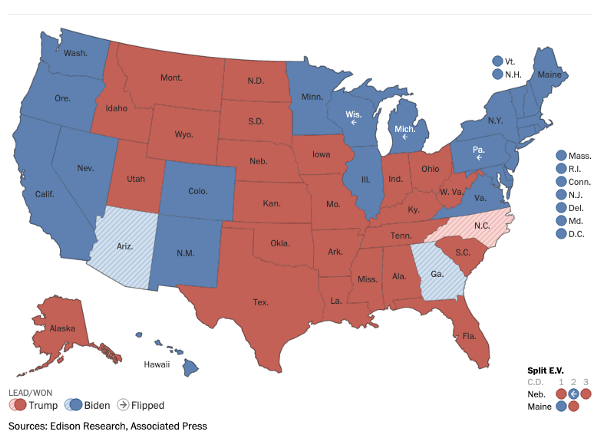
But beyond these few examples, spatial patterns were hard to find. The New York Times “arrow map” (building on similar maps from 2012 and 2016) showed shifts going in all kinds of different directions with little rhyme or reason. To quote Nate Silver in response to this map: “¯\_(ツ)_/¯”
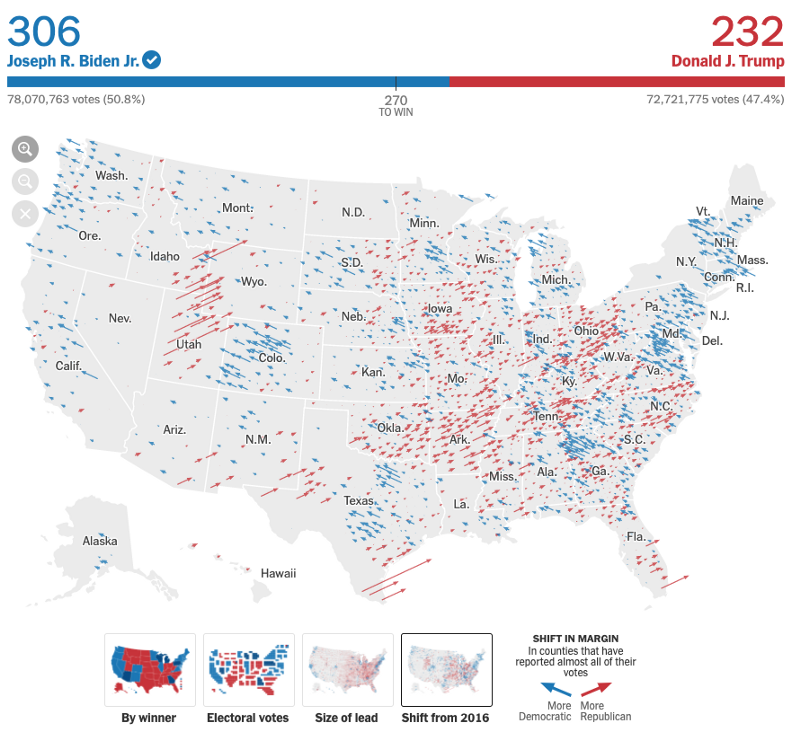
The Washington Post’s had a similar wind map inspired version, where the upward flow of the lines indicates increased turnout, and the left- or right-ward flow shows a partisan shift from 2016 to 2020. I think we will be unpacking these patterns for quite some time…
Meanwhile, excellent map meme went around again, showing that you don’t need to use the current election’s data to tell a story that is still relevant today:
Similarly, as attentions turned to the imbalances of the Senate, this map (annotated by Steve Chiotakis) went viral across our feeds:
And every year there is an outcry about the inaccuracy of the ubiquitous election maps showing each state either in solid red or solid blue. Again so it was this year, with a “Purple States of America” map by Greg Albers going viral:
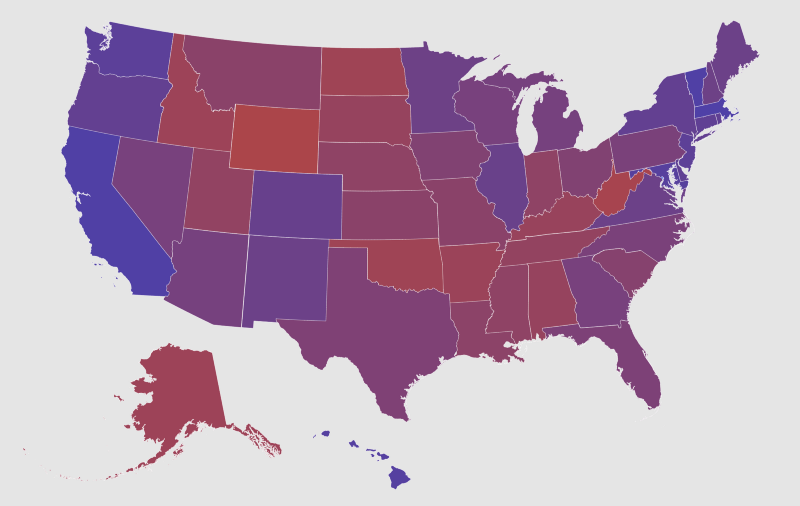
Whether or not the purple maps are more “accurate” (we might argue that the harsh solid red and blue maps to a better job telling an accurate story of the Electoral College’s inherent first-past-the-post flaws), the Purple States of America site links to some interesting research showing that purple maps make viewers perceive the country as less polarized. By showing showing the polarization of Electoral College votes in stark red and blue, are we as cartographers creating more polarization in the minds of our map readers?
Oh, and speaking about colors, can we pause for a moment and appreciate the variety of different shades of blue and red each media outlet chose? I hope someone is writing a blog post solely on this topic, digging into the subtle meaning behind the New York Times’ no-nonsense pairing of #1d76b5 and #c73339, or the Washington Post’s somber, chalky palette of #5e81b2 and #c56147, or the Wall Street Journal’s Lite-Brite-inspired combo of #23a0da and #cf424a, or Bloomberg’s take on the 90s “Jazz” Solo cup with #3db9fc and #fc5970. (Also, a bold move by the Washington Post to forgo a cartogram this year!)
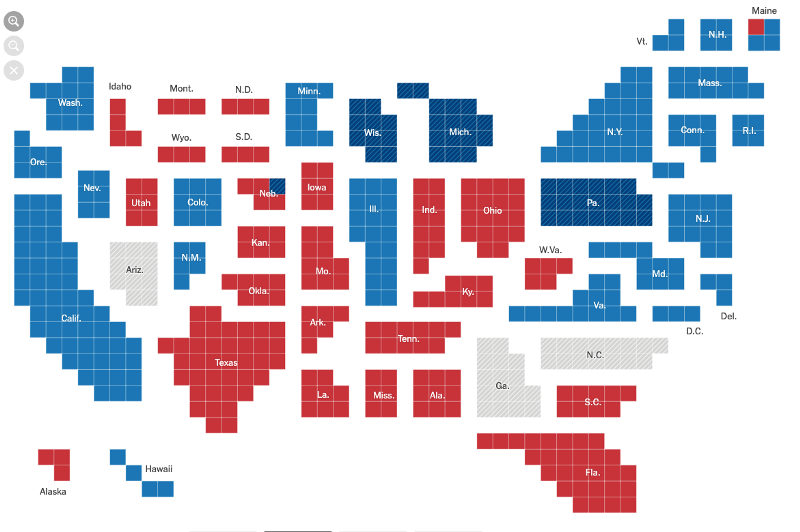
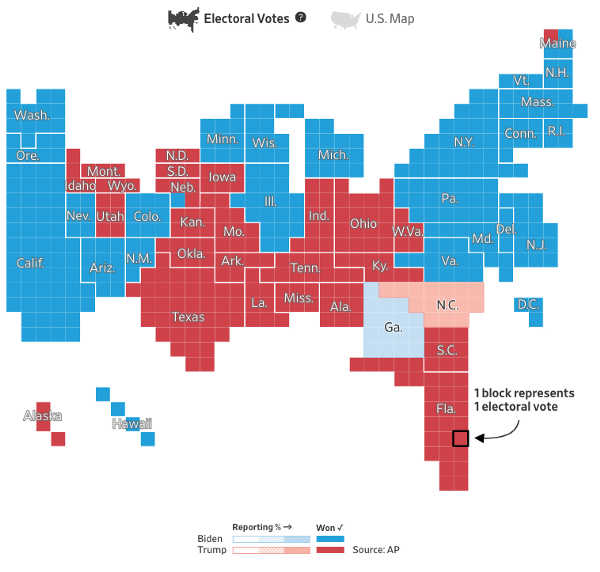
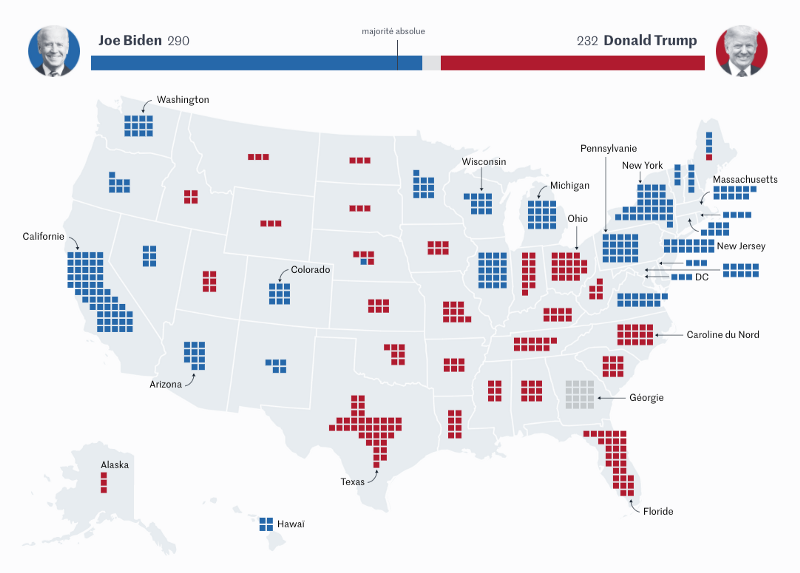
As you can see in these examples, cartograms were popular this year (as always) although slightly less confusing variation from Le Monde (using disconnected cartograms floating on recognizable state shapes) got a lot of likes among the non-cartographers in our network:
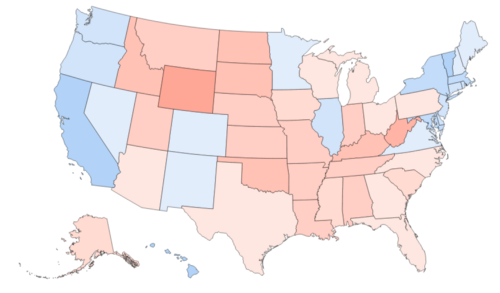
As another way to rethink the endless red/blue maps that tell us little about population or the closeness of the race, the New York Times print edition had an interesting map showing county vote margins as proportional circles. These margins are correlated with population, but not always: in some cases high population areas almost disappear on this map. A metro area with narrow margins (like Phoenix or Las Vegas) shows up as a tiny dot, and counties such as Tarrant County, TX (home of Forth Worth and a population of 2 million people) doesn’t even show up because Biden and Trump split its votes almost equally.
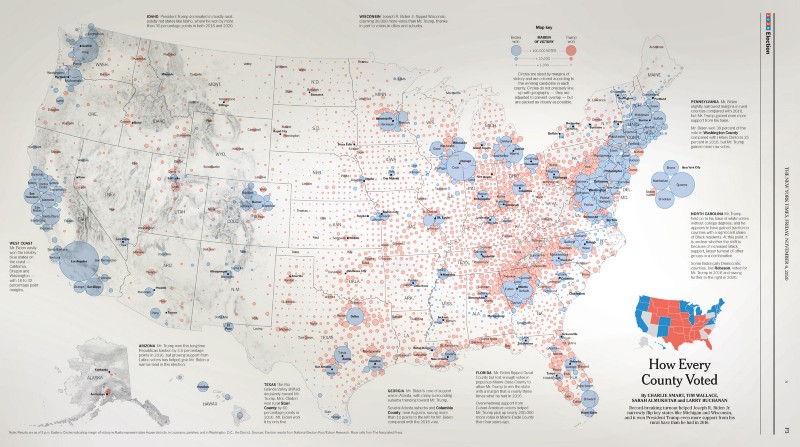
If we read the comments on that tweet, we see that most people viewing this map don’t understand that it’s mapping margins of victory, almost all of them think it’s a representation of population, like the “land doesn’t vote” animated map shown earlier.
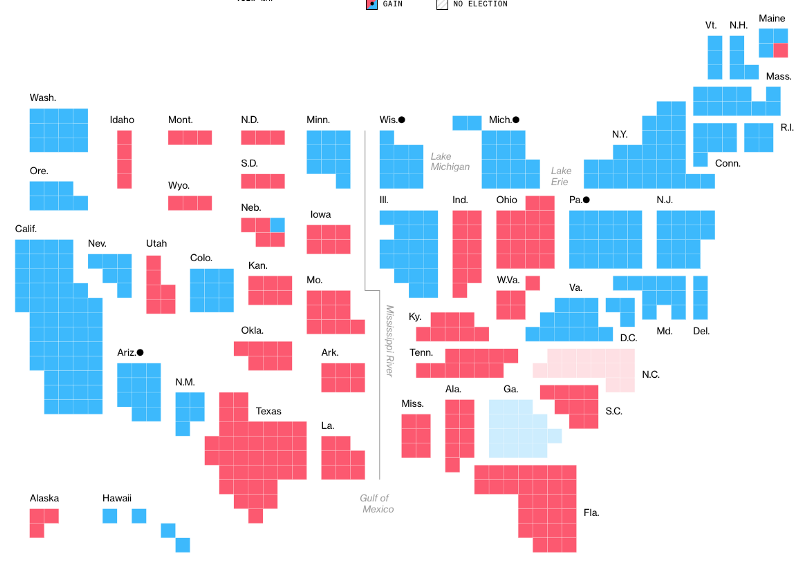
If we want to map only the margin of victory, what if we map these as rings instead of dots? We put together a quick prototype using VizHub to see if this method would work. In this map, the outer radius is the number of votes for the winning candidate in each state, and the inner radius shows the number of votes for the loser:

Effectively this map only shows excess votes, basically the wasted “extra” votes that are just running up the score. The inner radius shows the votes for the losing party in each state, and the outer radius shows the winning party. So a high population state with a narrow win would be a big thin circle (like Florida or Texas) and a big state with a wide margin is a big thick circle like California.
This map shows a major flaw in our our Electoral College system of electing the president. Once you have enough votes in a state to win a plurality there, any extra votes are wasted. These extra margins don’t do anything to offset your opponent’s votes in other states. All of those thick red circles in states like Oklahoma and West Virginia represent votes that could have helped Trump win if they were in other states. The big blue circles in California and New York represent millions of surplus Biden votes that didn’t gain him any extra electoral votes. It’s no surprise that in most states the outcome is already determined, so that voters don’t feel like it makes any difference whether they vote or not (for president at least).
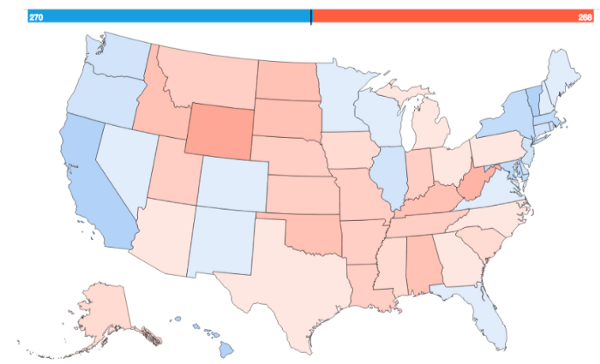
Since this year’s winner of the popular vote was also the Electoral College winner (unlike in 2016 and in 2000), there has been slightly less discussion about reforming and abolishing the EC this year… although we shouldn’t get complacent! As of this writing, a change in just 80,000 votes spread across the four closest states (Arizona, Nevada, Georgia, and Wisconsin) would give Trump an Electoral College win, despite losing the popular vote to Biden by over 5 million votes. Dave Wasserman points out if you just flip AZ, GZ, WI, and Nebraska’s 2nd district, you could flip the electoral college with a change of just 66,702 votes.
So how do we fix the Electoral College? That’s a topic for another blog post, necessitating many more maps and charts. But for now, let us leave you with one way not to fix the Electoral College: choosing electors by congressional district, as Nebraska and Maine do. We saw a lot of people sharing the story of Ernie Chambers, the state legislator who fought to keep Nebraska’s system of allocation, which made it possible for Biden to win one of Nebraska’s electors this year (as Obama did in 2008). Chambers’ story is inspiring, but due to the possibility of Gerrymandering, it is a dangerous model if replicated everywhere across the country. For more details, read along with this thread:
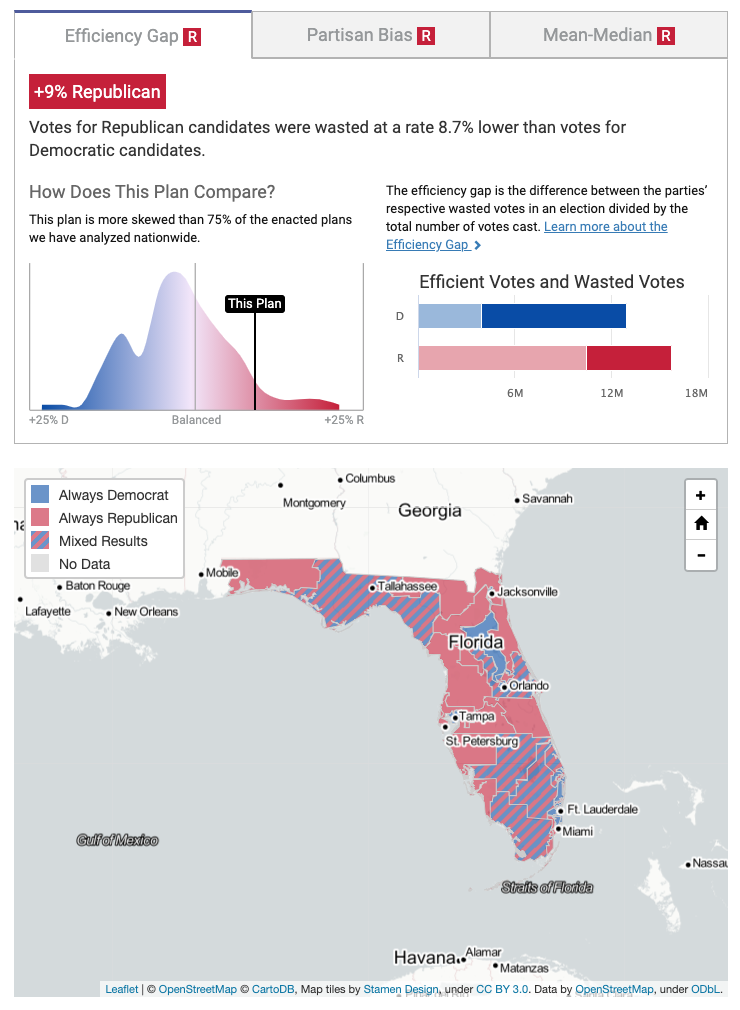
We could also write volumes about Gerrymandering, and perhaps we will in the coming year as the 2021 redistricting cycle kicks off in earnest. The new congressional boundaries drawn in the next year will have serious ramifications for the House of Representatives and for state legislatures for the next decade. A few years ago we worked on a prototype open-source redistricting tool, and we’d love to find a partner to continue that work in 2021. We’d also encourage you to check out PlanScore, a project led by Stamen alum Michal Migurski and supported by our friends at GreenInfo Network, which has built the most the most comprehensive historical dataset of partisan gerrymandering ever assembled.
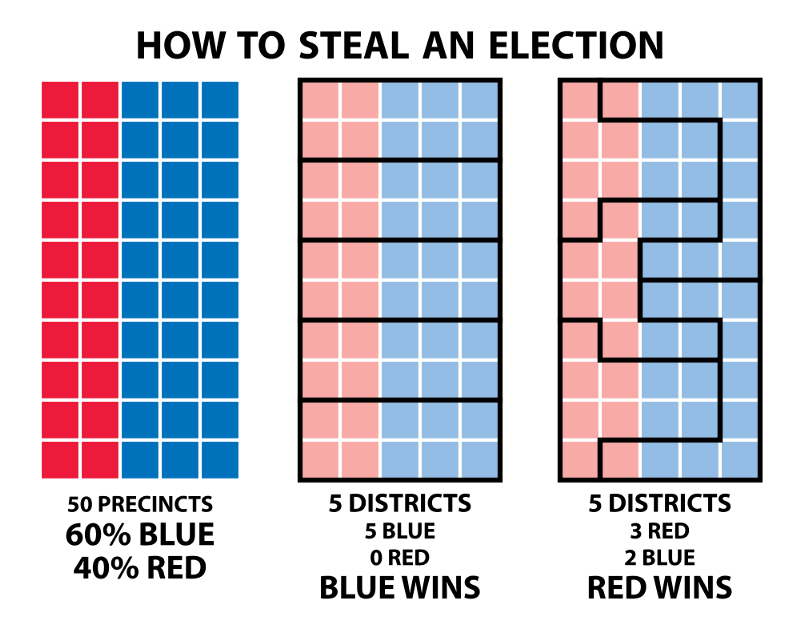
And in case you need a refresher on what Gerrymandering is and how it works, we haven’t found a simpler graphical explanation than this one:
Oh and finally, we’d like to remind everyone that even state boundaries are arbitrary historical constructs (see, for example, “How 13 Rejected States Would Have Changed The Electoral College” from Elle Koeze at FiveThirtyEight or “The United States …That Could’ve Been” by our friend Andrew Shears at Muncie Map Co). Even tiny changes in state boundaries would lead to widely different election results! Our favorite demonstration of this concept is the Redraw The States tool by Kevin Hayes Wilson, and the accompanying Medium post. We can’t wait until he updates the site with 2020 data! [UPDATE: here’s the 2020 version]
This year we saw continued refinement of traditional election maps styles, and an exciting (and nerve-wracking) new frontier developed with the visualization of post-election ballot counting. Dataviz practitioners are struggling with challenges of how to show uncertainty and how much uncertainty can be shown while still making our visualizations clean and easy to understand. Election cartographers are dealing with their own dilemma of how much to show the polarization and inequality that currently exists in our electoral system (with the risk of reinforcing it) versus making counterfactual maps of systems that could or should be.
In this post we’ve barely scratched the surface of all the interesting maps and charts we’ve seen, and clearly the visualizers and map makers are nowhere near running out of new ways to explore and represent election data. Interested in learning about more maps like these? Get in touch if you’d like to invite us to speak on this topic, or if you want to hire us to work on your mapping or data visualization projects. Drop us a line!