
Our second full week in Stamen HQ2 still found us wandering around the new space, blinking at the possibilities. There’s a whole room full of empty and as-yet-uncrushed boxes, a room full of my old stuff (I used to live at Stamen HQ1, back in the day), a room with mostly plant-free large pots from our old space that will eventually become holders for our new trees, and rooms that we’re mostly unsure of. On the flip side I’ve set up the orchids near the west window, we have a little new sitting room next to my office that looks out on the mad sprawl of 16th and Mission as well as downtown San Francisco, the whiteboard paint on the walls is being used, we had our first client visit day, we’re laying down rugs and buying chairs things are generally coming together, and it’s starting to feel a bit more like home. It took me 8 years of place making to get the old studio right, and it’s sometimes hard to remember that we’ve only been here for 2 weeks. But HQ2 has good bones, and I can’t wait to see how it looks in a year.
Out in public, a few things to report:
Thing 1: We released a new map project for the ACLU called The War is Everywhere, which shows the locations of those held under the indefinite detention regime set up during the War on Terror (and which President Obama, mercifully, seems to be making steps towards curbing the worst excesses of. It’s always chilling to engage with this material — we have another project in the works which deals with a similarly grisly aspect of the previous administration’s policies — but it feels good to be participating in some small way in America’s rehabilitation after a long period of madness and fear.
Thing 2: The City of San Francisco, already in our good graces for releasing the official crime statistics that make San Francisco Crimespottingpossible, has released a whole new swath of data going back to 2003, making the project that much more interesting. A recent breakdown of the crime types that they’re now providing looks like this:
Other Offenses (5812) / Non-criminal (2907) / Warrants (1408) / Suspicious Occ (1063) / Missing Person (853) / Fraud (489) / Forgery/counterfeiting (391) / Weapon Laws (312) / Trespass (304) / Disorderly Conduct (202) / Drunkenness (185) / Stolen Property (164) / Driving Under The Influence (140) / Kidnapping (109) / Liquor Laws (87) / Runaway (76) / Loitering (36) / Family Offenses (27) / Suicide (25) / Embezzlement (22) / Bribery (12) / Bad Checks (8) / Gambling (7) / Extortion (7) / Sex Offenses, Non Forcible (4)
So we’re clearly going to have to find a better organizing scheme than the 13 category-strong one we have now, without turning the project into one giant checkbox, a situation it was explicitly designed to provide an alternative to. In the meantime the project now has links to prostitution, though murder is still conspicuously absent — so more on this soon. Shawn has been totally rocking this project and the relationship with the City, and we’re learning how to delegate proper time to engagements with civic infrastructure — it takes time, and (so far) there’s no money in it, so we’re thinking about how to balance that with the demands of interesting client work.
Thing 3: Another interesting but profit-free project we’ve had running for some time, Cabspotting, has had some hiccups in the last week. Something’s up with the feed, and we’re getting only about 10% of the taxis coming through as we used to. There’s been a sharp uptick in mail about it, as it turns out that lots of people are using the feed on a regular basis — which would have been nice to know, people — so we’re going to have to take a look at that & figure out what to do. I really want to keep the project going — it’s one of those projects that lets us have conversations about digital civic infrastructure that are hard to have otherwise.

One option would be to pickle it: to have it displaying, say, what the data looked like in 2008, when things were more stable. This would be sad, as there’s something about saying “this is where the Yellow Cabs are now” that can’t quite be matched by a canned dataset. We’ll see. Maintaining these ongoing not-profitable projects over many years is something we haven’t quite figured out how to handle; it’s important to do, as it serves as a benchmark for what’s possible and for what should be done, but it can get lost in the flurry of paying client work. Sha has been poking at me to find ways for, say, the Knight Ridder Foundation to fund some of these projects moving forward (they gave $485,380 to fund a variety of projects last year, including Development Seed) and we’re interested in finding ways that these projects can be more than simply lures for potential client work down the line.
Thing 4: CNN wrote an article about data visualization in general, which had a bit about us in particular:
“Cities like San Francisco, Washington D.C., and New York meanwhile hold developer competitions to encourage greater use of the data sets they’re releasing, with iPhone apps being of particular interest.
“The variety of clients at Stamen, a San Francisco firm noted for its data visualizations, speaks to the craft’s increasing reach. Financial institutions, architects, carmakers, design agencies, museums, tech firms, political action committees, and universities have all knocked on Stamen’s doors.”
The continued movement of data visualization from the academy into the mainstream is, as you can imagine, of keen interest here at Stamen — it’s broadening the conversation from data nerds to the broader public. At some point it’s not going to be accurate any more to say that it’s movinginto the mainstream anymore, and the work will be more about innovation within a mature medium than about increasingly bold salvoes against previously walled-off datasets. Eventually we’ll be firmly in the realm of fashion design, which (as Ben is so fond of saying) is how Stamen should really think of itself: where seasonal iteration is the point, technical experimentation is considered essential to the work, and style vies with substance for the upper hand and often wins. And fashion, as Karl Lagerfeld puts it, is “ephemeral, dangerous and unfair.”
An iron triangle of iPhone, civic data, and data visualization feels unavoidable at this point, at least among those writing about visualization in the press. One of our clients talked about how, far from the iPhone being a fancy phone for yuppies, it’s better to think about it as a primary computer for low-income people. So we’re going to have to address this sooner or later, hopefully sooner; it feels like location-specific mobile work is just at our fingertips.
Thing 5:I spoke at two symposiums at GAFFTA, the new art space where our “Tenderloin Dynamic” is installed in the mezzannine, withCasey Reas and Camille Utterback.

On the second night, we had a wide ranging discussion about the role of the public in our work, how feedback impacts the design/art process, the use of public datasets in art, and so on. The first night was a visit from an art collector’s club put together by the Pacific Film Archive and Peter Hirshberg, which was a chance to be exposed to the more, shall we say, refined audience for digital art, and a new and intriguing experience for me. We’re increasingly being asked to participate in museum and gallery shows, and are learning to insist on a live internet connection as a condition of our involvement, which makes it easier to digest the change from online-only to site-specific work.
Thing 6: Mike posted some notes about Canvas and HTML5 and how these newish technologies are starting to look like a potential new avenue for online visualization. In particular, there seem to be some intriguing possibilities in managing map warping, which could be a useful tool in geo-rectifying old maps for use in more modern formattings:
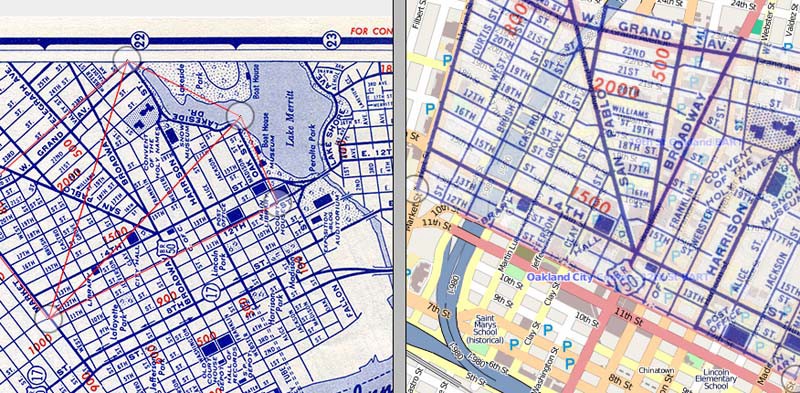
Strictly speaking, this happened the week before last, and not this week, but it took me a while to digest it, so Thing 6 is more properly “I spent some time wrapping my head around Mike’s latest thing.”
And so, phew, and yay HQ2. Tom’s written another in-studio diary “week in Stamen” mail, but of course it’s peppered with references to “Big Client A” and works-in-progress, and we’re not quite sure how to get around that if we want to make it public. In the meantime, I’m going to have to learn how to write faster.