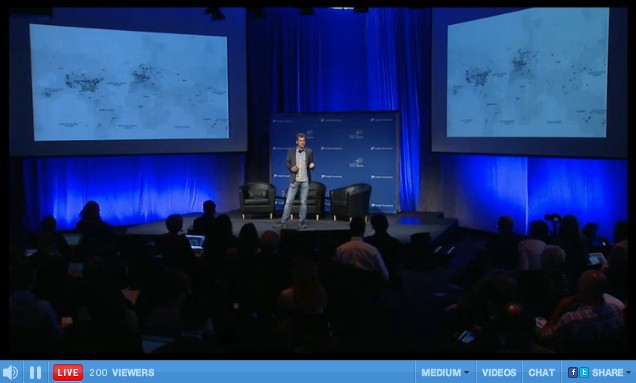
Nathaniel showcased nearly two years of City Tracking in Boston last Monday at the MIT/Knight Story and the Algorithm conference. You can read about this years’ winners here, as well about the changing nature of the grant: shorter cycles, more opportunities to apply, that kind of thing. It’s worth a look.

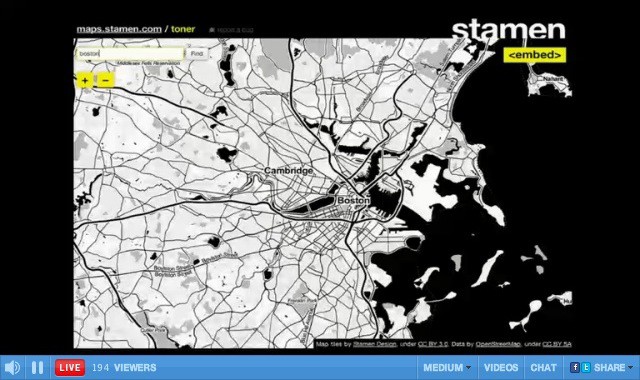
The City Tracking project started off with Dotspotting.org, which allows mapping of data spreadsheets. The project still sees active use, but after we made the Toner tiles available for download we started to notice that more people were expressing interest in the background maps than in the ability to put dots on them.
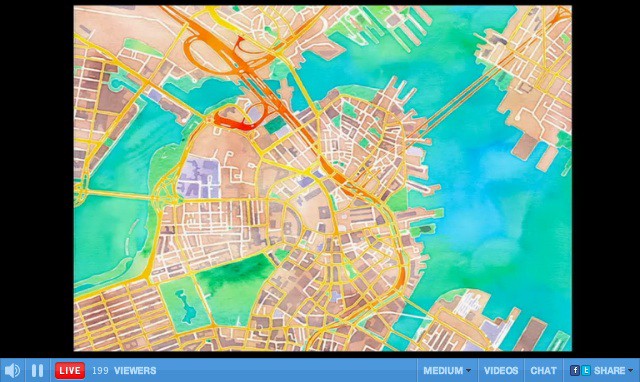
Responding to public feedback while the project happened was something we were interested in from the start, andhttp://maps.stamen.com is the result: a browsable, embeddable, and otherwise immediately usable map of the whole world that can be used in Google Maps, Modest Maps, and other mapping APIs without having to download all of OpenStreetMap or tinkering with servers and technical code.


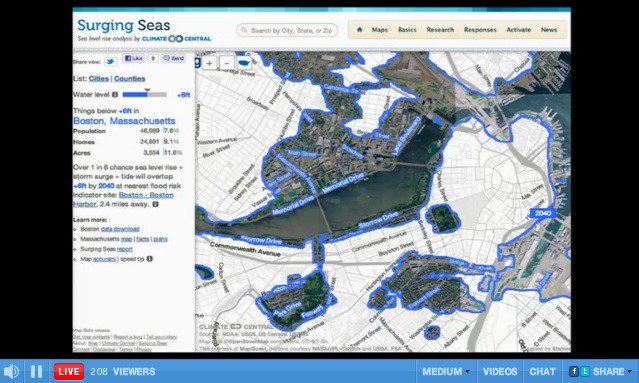
Nathaniel closed with a project we launched in March showing how climate change can be made personal on the street level, instead of the usual course brush strokes, with Climate Central’s surging seas project.
These thin slices of big data are bite size morsels of aha. We hope you like them!

