One of these days I’ll get around to updating the maps section of our site, ’cause things’ve changed since theCalifornia Stimulus Map (although I still think the Robert Louis Stevenson quote is pretty good, it’s basically 1/2 of our whole business plan). In the meantime I wanted to share a few things that Mike Bostock, who’s taken a break from his studies at Stanfordand contributing to the beautiful Protovis project (check out these examples) to work with us at Stamen on some browser-based mapping projects. We’ll be releasing these in a more formal way in the next week or so, as part of our ongoing work with SimpleGeo, but I was enamored enough of these examples to want to post them ahead of time.
Rotation
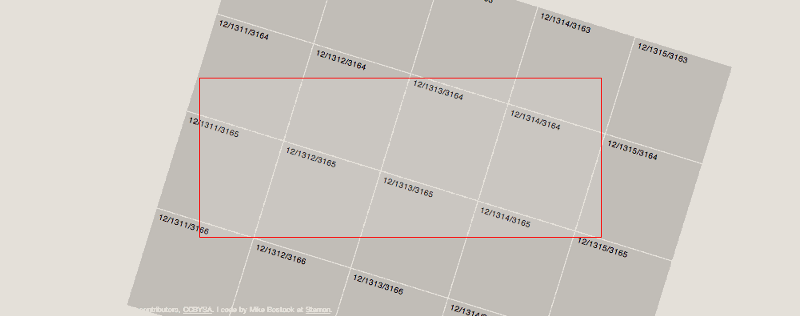
The first lets you manage tiles that are rotated off of the north-is-up tyranny — I say again tyranny — that most browser-based map engines lock you into, by making it possible to manage gridded tiles that are rotated at arbitrary angles. If the red rectangle below is the outlines of the browser, this demonstrates the engine’s ability to keep the tiles in order no matter what angle the tiles are at. Pressing ‘a’ and ‘d’ will rotate things slideways, should you choose to:

Rotation and zoom:
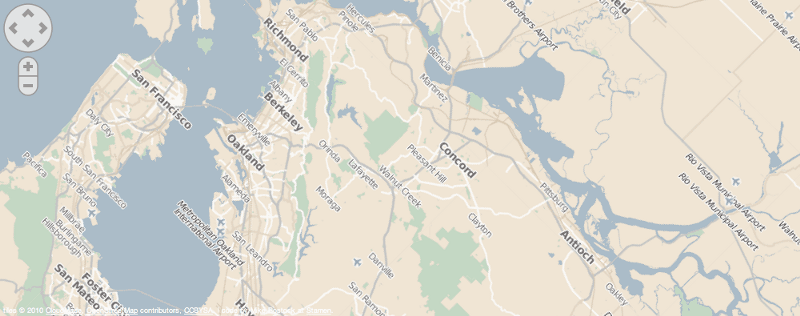
What this gets us is the ability to arbitrarily change the rotation of maps that we’re working with, independent of zoom level, so we can start to do things like easily look at the more eastern stretches of the Bay Area in a horizontal format, start to get views on the relationships between cities and towns and oceans and things that north-is-up leave behind on the table. And it can zoom, baby, take you all the way into Discovery Bay and back out again if that’s your thing (click & drag around to see this in action):

Tile scaling:
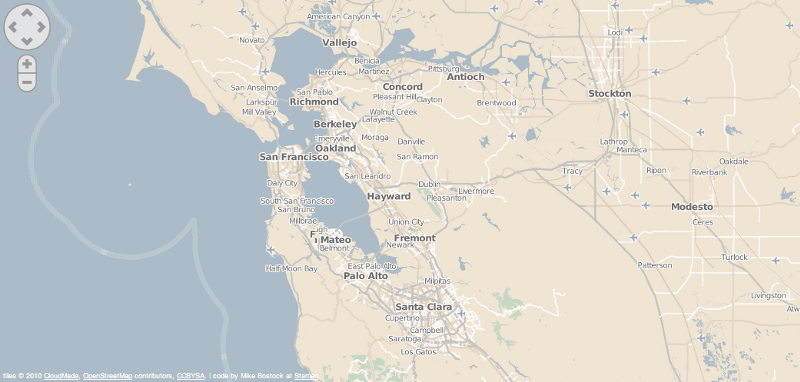
And while you’re setting longstanding map conventions on their ear (the madness! dogs and cats living together!), you might as well take things one step further and change the zoom level on the tiles you’re requesting, so that a perfectly normal-looking and well-behaved slippy map, much like what you’d see here:

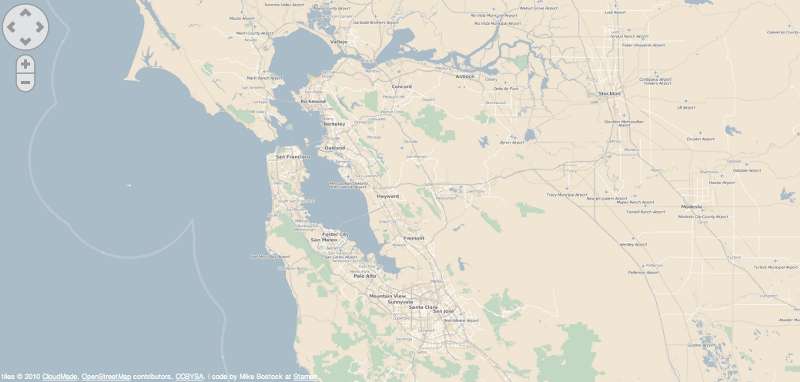
is suddenly loading twice as many map tiles, at twice the resolution, and displaying them at half the size that they’re normally shown at:

To which you might say: so what, map nerd? On the second one, I can’t read the text.
To which I’d probably say yes, ok, not-map nerd, but — which one gives you a better overview of the parks system in the Bay Area, the green stuff? Particularly around Half Moon Bay & the south Bay, there’s detail in the second view that’s simply not available in the first. And yes, you could maybe get to this view more directly, by firing up your desktop GIS system and running a query on the statistically relevant open space bounding boxes between a certain lat & long position south of San Francisco. But from where I sit that looks an awful lot like knowing the kind of answer you want to get, from the kind of question you already know how to ask. Somebody — in this case Stamen, since we designed this tileset, decided that you needed to be able to see green stuff at zoom level [n] and not at [n-1]. Did they (ok, we) make the right decision? How would you know?
The exciting part, for me, about this work is that it let’s these kinds of questions emerge in a way that’s opportunistic and dynamic and lets the medium speak for itself in a voice that comes directly from the actual material. All kinds of decisions are made in the crafting of a mapping tileset about what cities to show at what zoom levels, what kinds of features to display and how, where borders are between countries, and so on.
The idea that these kinds of decisions, and the ramifications that might fall out from these decisions, is in our hands, up for dispute and dialogue, available for messy debate and talk pages and inadvertant discovery…well that’s the whole point, isn’t it?
This is the kind of work that makes me want to code again, to fill directories with numbered iterations on the same idea, make the kind of thing that friends who code would step through and think “I wonder whether you could…oh right!” We’ll see.
