Visualizing Obamacare
Tracking the impact of the Affordable Care Act on California
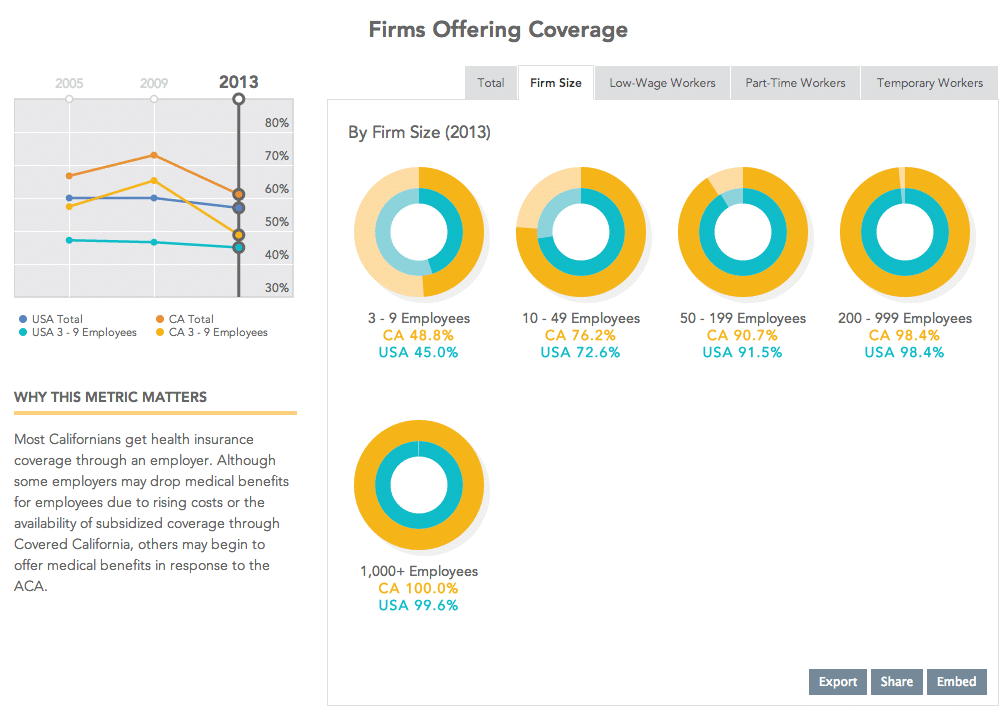
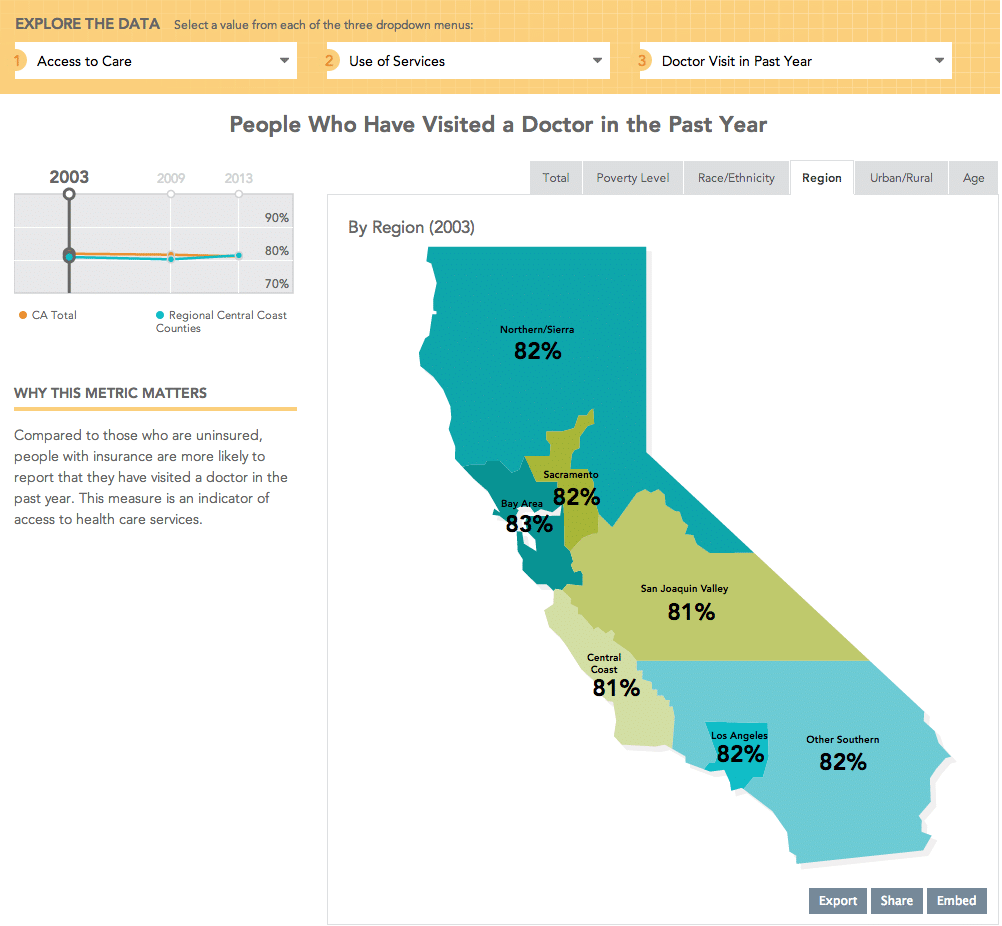
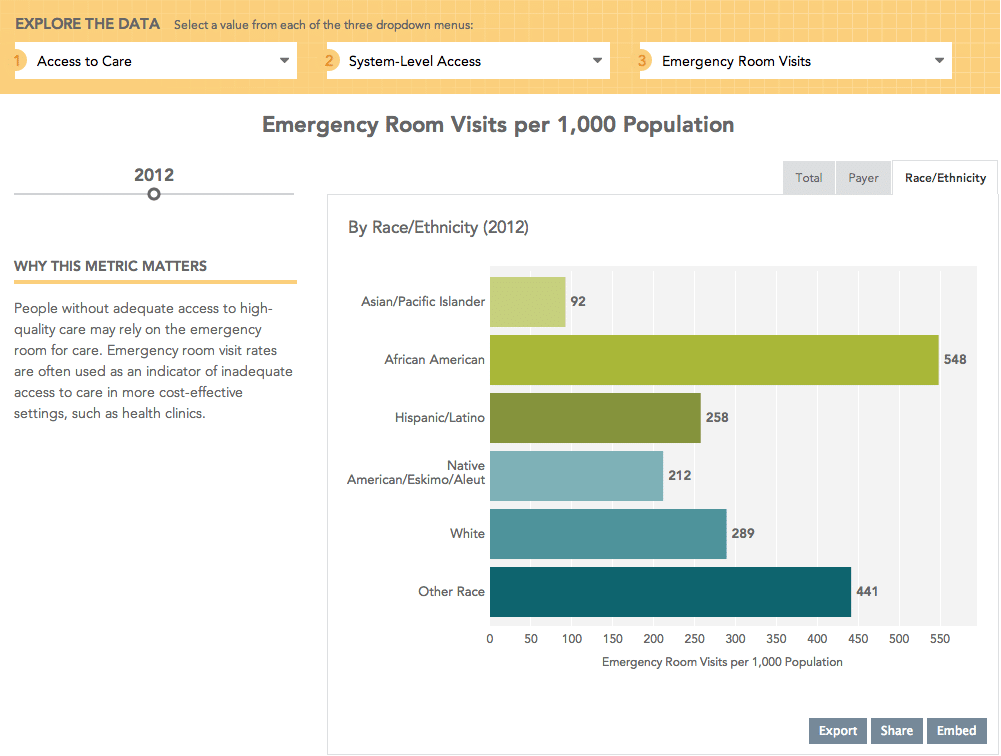
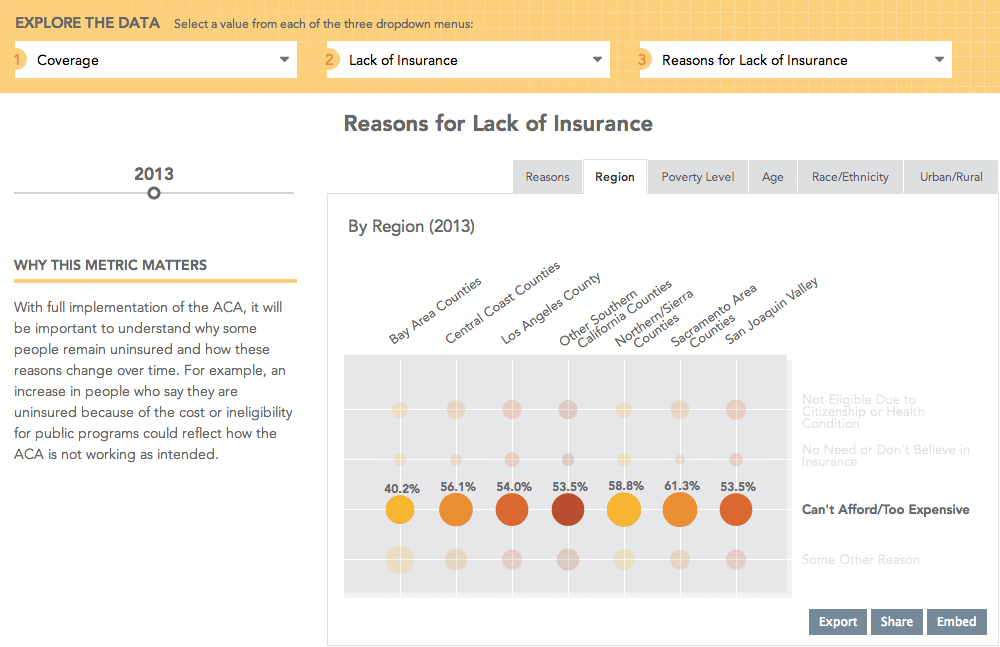
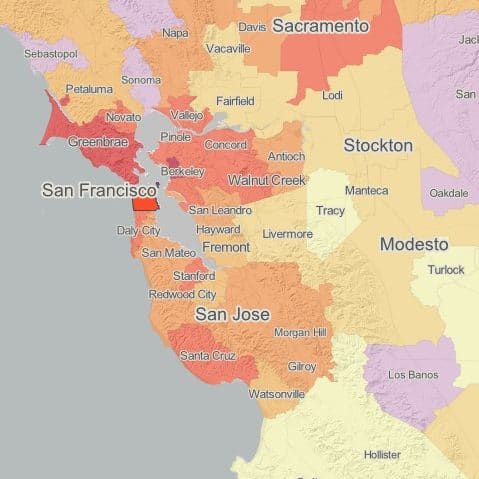
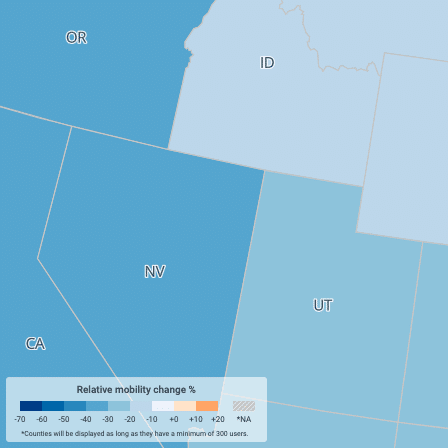
ACA 411 was a deceptively simple interface into a rich dataset that covers everything from how many people are uninsured in the San Joaquin Valley (18.1%) to how much a small firm pays for health insurance per person ($7,379). ACA 411 covers more than 40 different indicators at launch, and CHCF will be adding data over several years, tracking long-term trends and adding new indicators in the future.
It was initially a bit daunting to develop a systematic, dynamic way to display all this raw data, but we were determined to help make the ACA understandable by applying some delight to the figures.
Within each indicator, the data is sliced in several ways: types of care, providers, demographics, enrollment, quality of care, income levels, even geographic averages. With so many categories, the data can give you a general overview or a very specific peek into health coverage.