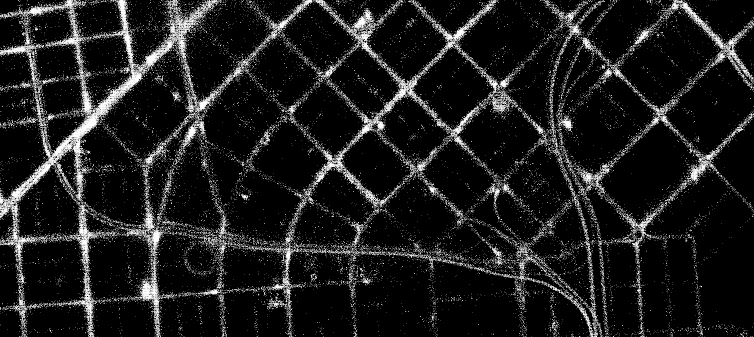
I’ve been talking a bit with Eddie Elliott, local designer/technologist and all-around raconteur whose beautiful digitial work predates the web, about Cabspotting lately. We (Stamen) keep meaning to get back to the project and do some new investigation, but something else (i.e. paid work that we like to do) keeps getting in the way. Eddie’s stepped into this gap, and been using the Cabspotting API to produce some really stunning work. You can read more about it at a page he made for it athttp://cabs.lightmoves.net/—in particular I like the calculations of the center of gravity over time, and he’s pointed out an error in how we’re plotting latitude vs. longitude (ouch) — but it’s the high-res long-term point maps of San Francisco that make me the happiest, and provide some interesting new ways to look at the city through the data it throws off.
So first of all Eddie’s using dots instead of lines, which makes sense over longer periods of time. This image shows 5,744,623 cab-spots (what Eddie calls individual cab GPS locations), recorded over the course of 31 days (44,640 minutes) from March 21st to April 21st, 2007, and it’s just lovely:

