Well it’s a little late to be writing an end-of-2007 wrap-up, but perhaps that’s OK. Last year I think I made my “plan for the year” in, well, May 2007, so things are moving in the right direction.
In any event 2007 was an exciting year for us here at Stamen: we delivered work to an outstanding group of clients, we travelled all over the place talking about our medium to audiences large and small, and we strengthened our bonds with several smart and wonderful colleagues who have changed the way we work and play for the better. The studio is growing in some important ways, and we’re working hard to keep our eye on doing beautiful and innovative work as the demands of being known for this kind of work start to increase.
We’re pleased and grateful to have been given the opportunity to work with smart, inspiring, and forward-thinking clients and collaborators. I’m particularly excited to see a demand for beautiful and useful mapping and data visualization in areas that we never anticipated, and I’m thrilled at the way Stamen is part of what happens as this incredible field takes off in a big way. A few examples:
Trulia:
We launched two mapping projects with real estate smarties Trulia, and are currently hard at work on another, to be launched in the next month or so. Our first project together, HIndsight, maps out the history of residential construction in the US — which I’ll grant you sounds kind of boring, until you watch Las Vegas bloom like some sort of impossible desert flower, or the way thatPlano, Texas and Levittown, New Jersey get stamped onto the land like so many cookie cutouts, and maybe watch them a few times. These animations of urban and suburban landscapes flowing and ebbing over time — like water, like streams, like waves, like fountains — have gotten stuck in the back of my head, and there’s something rattling around back there, something about mapping opening doors to a new way of seeing.
The Hindsight project in particular was a real clarifying process for me. In the process of investigating Trulia’s data, we tried multiple visualization ideas and metaphors — tree maps, clusterings of related search results, etc. — but when Tom Carden discovered that urban home data flowed like a river it was obvious to everyone that these maps needed to be scrollable and searchable. It’s rare that a project comes together quite so sweetly, but this one did.
Hindsight:

Search Results:
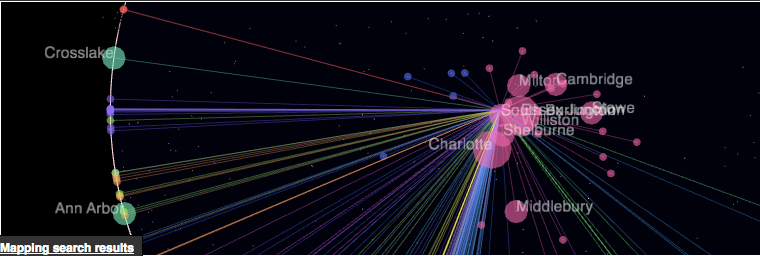
We also took a look at related search results on Trulia — i.e. when people search for Burlington, VT, where do they search for next — and mapped those onto an interactive structure that Trulia used to demonstrate the breadth of their knowledge of online real estate at the Inman Connect conference in San Francisco. This was the first commercial project we designed and built entirely in the Processing environment: it’s a new technology for the studio, so as well as giving us the chance to work with the wildly talented Ryan Alexander, it’s opened my eyes to a new kind of work that we’ll be pursuing more of in the future.

Digg:
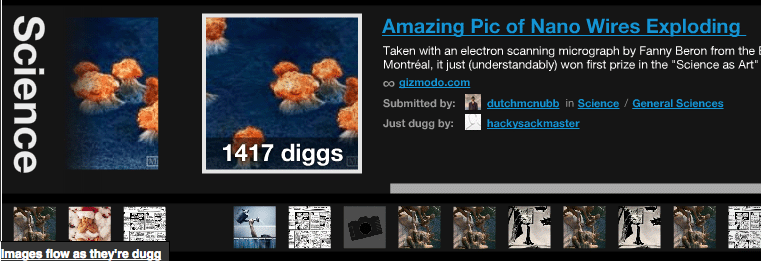
We continued and extended our partnership with social news innovator Digg, building and desiging two new visualizations of Digg’s ever-growing user activity: Pics. As well as being (we hope!) beautiful and informative in their own right, these two pieces are the first work we’ve done with Digg that’s been directly sponsored by Intel, and we’re starting to see this idea of sponsored data visualization percolate out into wider contexts. We also designed Digg’s new API, which we (and the world) can now use to build all kinds of new visualizations on top of, so we hope to see alot more where these pieces came from.
Digg Arc:

Digg Images:

Indigital:
Earlier this year we worked with INDigital, which provides wireless services for 911 calls in Indiana, on a live map showing the locations of emergency calls throughout the state. In contrast to some of the more ephemeral flows of data that we work with, the INDigital project is aboutreal stuff, people in emergency situations needing help right away — and that gave the project a kind of urgency that the studio really thrived on. Mike asked throughout the project whether there should be anything different about a map of 911 calls than, say, bike messenger pickups, and we’ve learned alot this year about the relationship between image and the specific kinds of data we’re working with.
INdigital Realtime Activity Display
Twitter:
We mapped out the network of people keeping each other posted on Twitter with a friend-of-friend relationship diagram at Twitter Blocks, a brief foray into 3d visualization that opened up some new doors.

Crimespotting:
What started off as Mike Migurski’s holiday project has turned into a prime example of the politics around access to public data. Our Oakland Crimespotting project coallates data from Oakland’s outdated and unwieldy Crimewatch site into a useful and highly interactive map of crime in that city, and lets interested citizens explore their neighborhoods in a simple and intuitive way. Unfortunately, the City of Oakland doesn’t quite see it way, and the project continues to be blocked by the powers that be in the halls of government. We strongly believe that citizens (and when we say “citizens,” we mean “us”) have the right to consume public information, and hope that the city comes to its senses soon. Otherwise we’re going to have to get, well, creative…
Crimespotting is the first public use we made of Modest Maps, the free open-source mapping library project which we wrote with our good friend Darren David. Modest Maps lets designers and developers wrap mapping services from companies like Google and Yahoo and Microsoft into a flexible and elegant Flash framework. So no more little yellow pointers and janky purple lines on maps from now on, please.
Transbay Terminal:
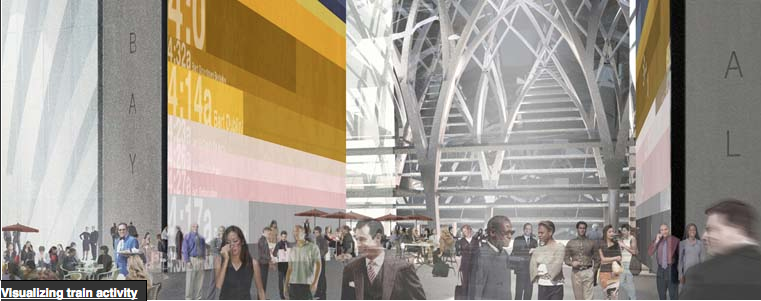
We worked on our first geniunely architectural project this year, contributing to a proposal by Skidmore, Owings and Merrill for a new Transbay Terminal in San Francisco. We designed a series of ideas for the 100-foot high interior/exterior walls of the terminal entrance, which would allow commuters to ‘read’ the building as a massive representation of transit flows:

Talking Out Loud:
We took our act on the road again in 2007. The idea that people get together in rooms and care about what we have to say continues to fill me with a fierce joy and pride, which I hope comes through when I’m speaking. We talked more at design events than we have before, bearing outMike’s prediction last year that “design” and “math” would move alot closer together. I’m seeing interest in the idea that data visualization and mapping can not only provide analysis but also something like spectacle, and this is a big part what we’ve been exploring during the last year publicly.
Anyhow we went all over the place, and had a great time:
- O’Reilly: Open Government Working Group, Foo Camp, Where 2.0
- OFFF, Barcelona
- South by Southwest, Austin
- Postopolis, New York
- AIGANY: Fresh Voices, New York
- Future of Web Apps
- xTech
What’s Next
There are a few things that I know about so far: I’m speaking at Web Directions North in Vancouver, and Stamen is presenting at UC Berkeley’s School of Information in February. We’re starting several new projects now, which I’m super excited about; more about those as they move further along but I can say that they’re different (in some ways by being much bigger) than anything we’ve done before.
We’re hoping to do more work in Europe this year, and are exploring the idea of opening an office in Amsterdam or Berlin at some point in the next year or so. Mike and I are headed to London on Tuesday to move this idea along further and if all goes well we’ll be arguing about names for Stamen East sooner than later.
And! I’m delighted to say that our Cabspotting project was selected to be part of the MOMA’s Design and the Elastic Mind exhibition in late February. We’re working this month on an installation-speciic version of the project which will be part of the on-site exhibition. More on this in a separate post; the show runs from February 24–May 12 2008, so if you’re in new York then, please stop by and see the show.
I know, right?
And Also:
Reading this, be the first to know that Stamen is hiring once again. I’ll have a more formal description (complete with aspirational copy, promises of outstanding opportunities, and pictures of flowers) soon, but: if the above looks to you like a good set of projects to have worked on in a year, and you see something of yourself in either this or this description, please do drop us a line.
As for me, I’ve just returned home from a week-long cleanse in southern California involving Ayurvedic treatments of all stripes, where I ate lots of mung beans and rice, lost 10 pounds without really thinking about it, and have come back refreshed and happy and looking forward to what the new year has to bring. I’m notoriously bad at sticking to resolutions (ask me some time how many times I’ve tried to quit smoking), but I do have two for this year: to remember that an focus on abundance, compassion and joy are the keys to growth and happiness, and to always wear my heart on my sleeve.
Happy 2008!
