
This week, the California Healthcare Foundation (CHCF), a longtime Stamen client, released a completely redesigned and updated version of All Over the Map, a tool to help policymakers, health professionals, and concerned citizens discover variations in the prevalence of elective procedures across California.
Why does such variation matter? Well, it turns out geography matters when it comes to whether or not a person gets a knee replacement or has a baby through induced labor. And location matters even when the data experts working with CHCF corrected for other factors, like age, race, socioeconomic status, and so on.
Using this map, one can discover that, if you’re a pregnant woman in Gardenia, you are six times more likely to have an electively induced birth as if you lived in Napa.
That’s a big difference!
All Over the Map 2014 is the third version of this interface we’ve designed and built for CHCF, going back to 2011. The key change this year was, well, change. With two data periods available for many procedures, we had the opportunity to highlight not just outliers in one time period, but also how much certain areas have changed over time.
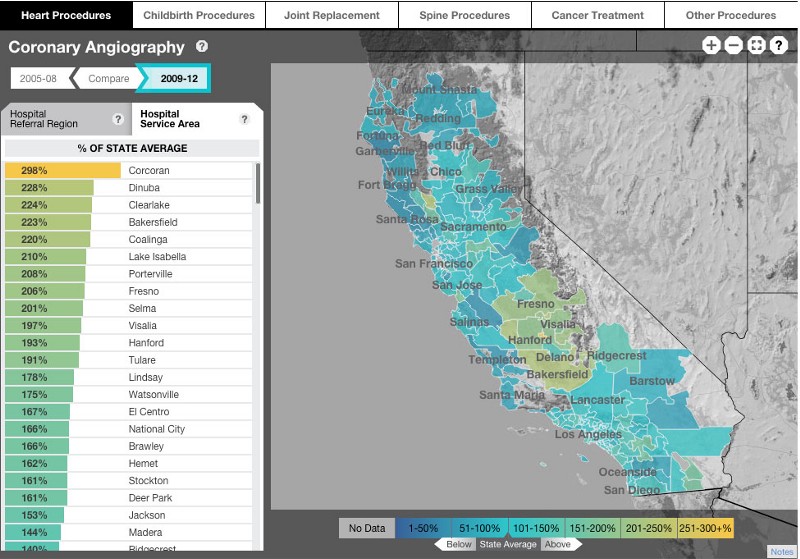
For example, though Clearlake residents had the state’s highest rate of coronary angiography from 2005 to 2008, that rate dropped by 47% in 2009–12.
Working closely with CHCF, we were able to create an interface that combines bold colors and simple bar charts with careful and refined interactions and subtle color gradations to bring beauty and subtlety to highly technical data. Color schemes and legends highlight outliers in the data, while thoroughly storing variables in the URL means that all states of the map are easily shareable.
How does your home region fare on the map? Find out!