
At Stamen, we specialize in cartography and data visualization, helping our clients to communicate with complex data. In particular, we’ve spent almost two decades designing and building interactive web maps using open source tools, such as our popular Watercolor map style using OpenStreetMap data. For the past year and a half, it’s been our privilege to work on one of our largest and most ambitious undertakings ever: collaborating closely with a team of Facebook engineers, designers, and data experts to roll out a global, multi-scale base map for all of Facebook’s billions of users. In late 2020, this map went live, and we’re extremely proud of the results.
A Global Base Map
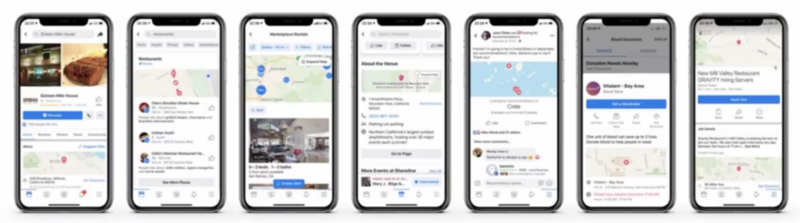
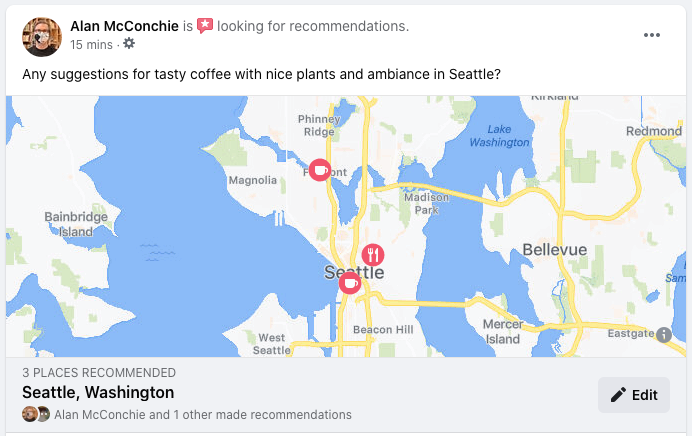
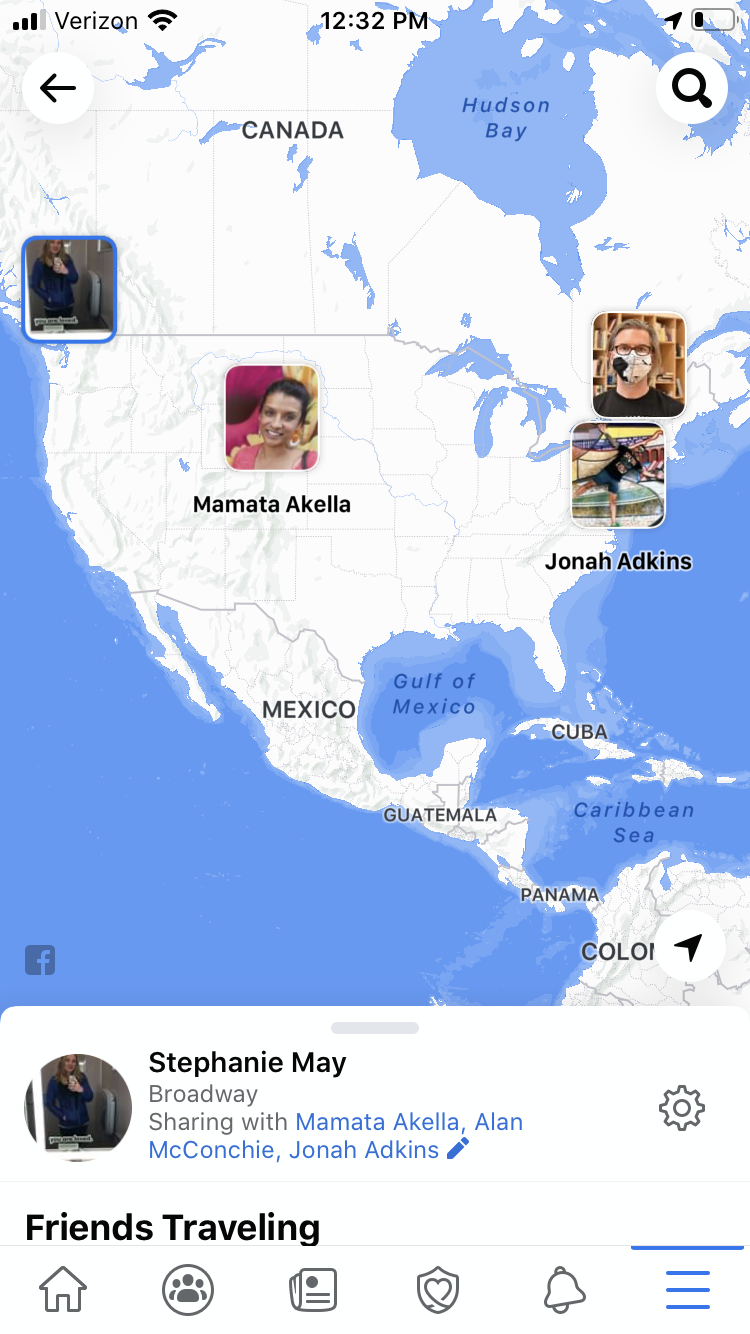
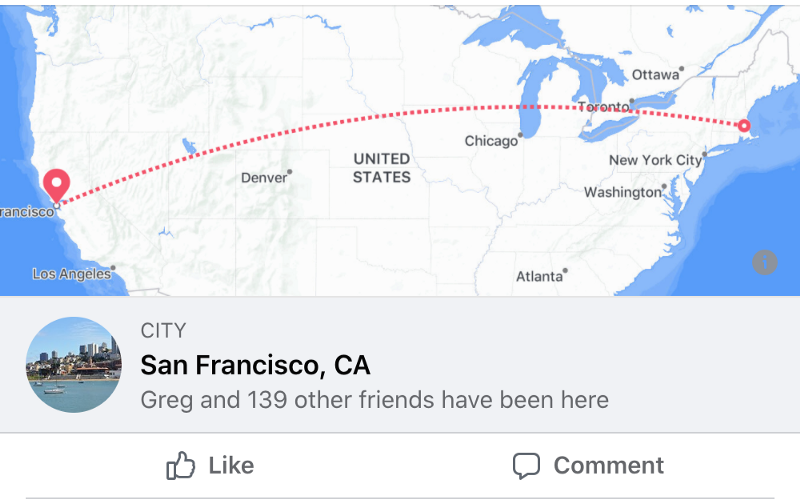
Facebook’s mission is to give people the power to build communities and bring the world closer together. Across the Facebook platform, maps are essential to bringing people together and are used in a variety ways, including checking in at a favorite park, searching a local community for cat cafes, or sharing location with friends.
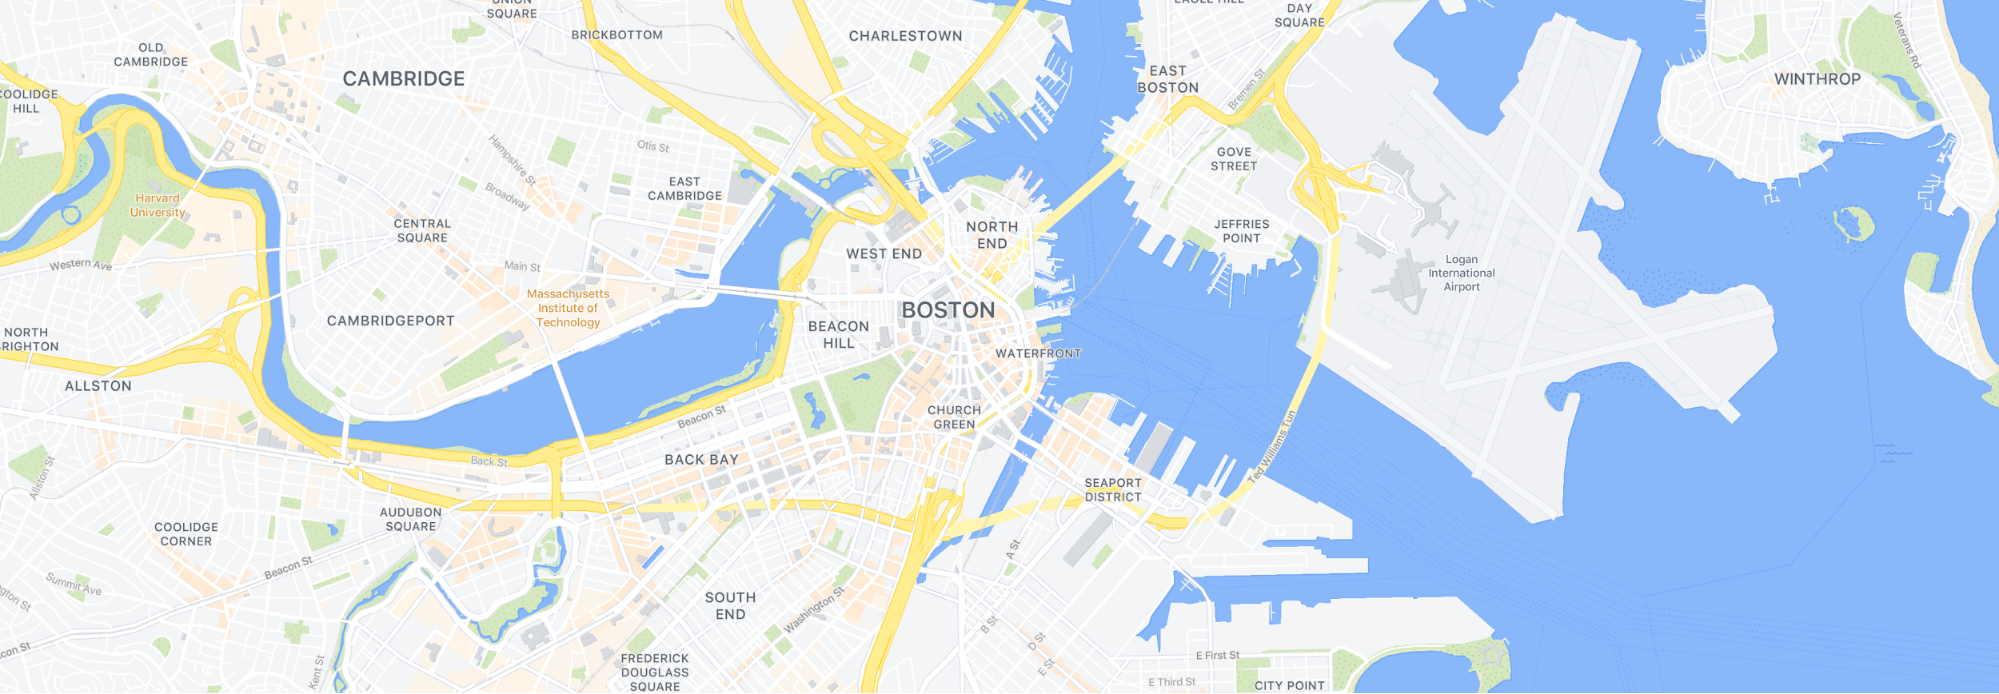
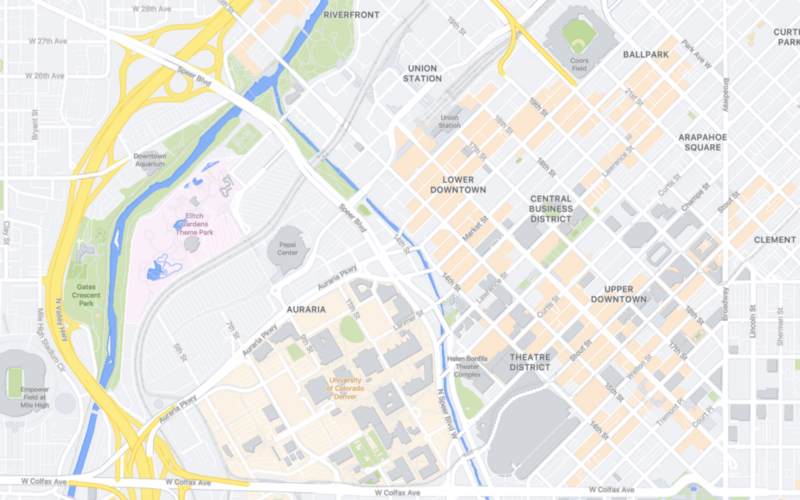
The Facebook map is a social map first and foremost. It’s meant to give a general sense of location through the lens of your community. Neighborhoods, parks, and social places are emphasized over “traditional” features like road networks.
Working as an embedded team with Facebook engineers allows us to bring cartographic experiences to the process of serving and scaling vector maps globally. This dynamic environment enables us to collaborate on data, tooling, and code around the entire map generation pipeline.
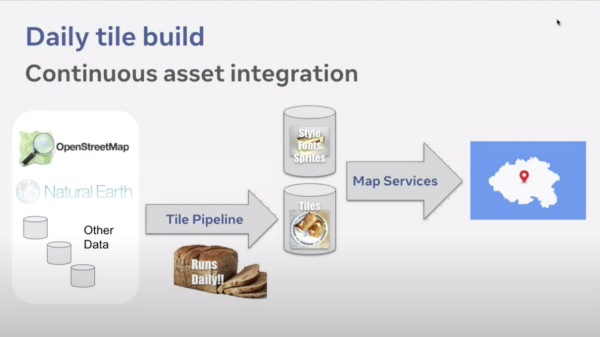
Part of what makes the map special is the team’s emphasis on open data to power this map. The primary data behind this map comes from OpenStreetMap (OSM), an open-source, global database of geographic features, often called “the Wikipedia of maps”. Without OSM, building this map would have been nearly impossible. Facebook recognizes the importance of open geographic data, and has become a major supporter of the OSM project. Facebook teams enhance existing OpenStreetMap data with quality and consistency checks from the Daylight mapping program, and even the data that is generated by FB internally, such as the building and road data from the mapwith.ai team is available to the OSM community through the RapiD tool. In addition to OpenStreetMap, at lower zoom levels our map builds on the foundation of Natural Earth, another open source curated dataset by and for cartographers (supported by Stamen and others over the years).
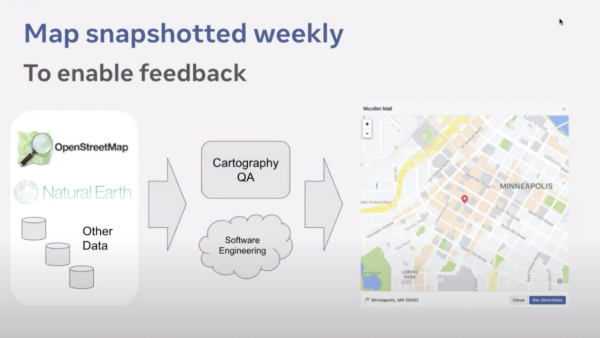
As cartographers and engineers, we are able to quickly iterate on this data on a global scale through a daily vector tile build. This feeds into our design process, which involves styling this data into the base map you see across Facebook apps. Before the map is released to the public, we work with Facebook’s quality assurance teams to ensure the map is free of bugs, glitches, and other unsightly data issues. Every week, we take an internal snapshot of the map for QA, with the goal of rolling out an updated map to the public every month, after it has been thoroughly reviewed.
Map Design
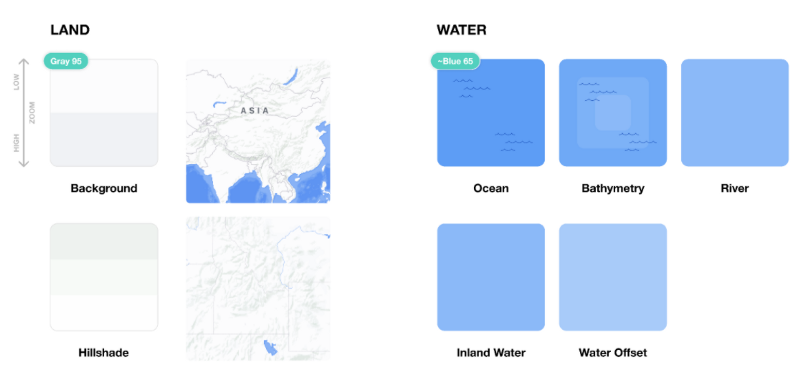
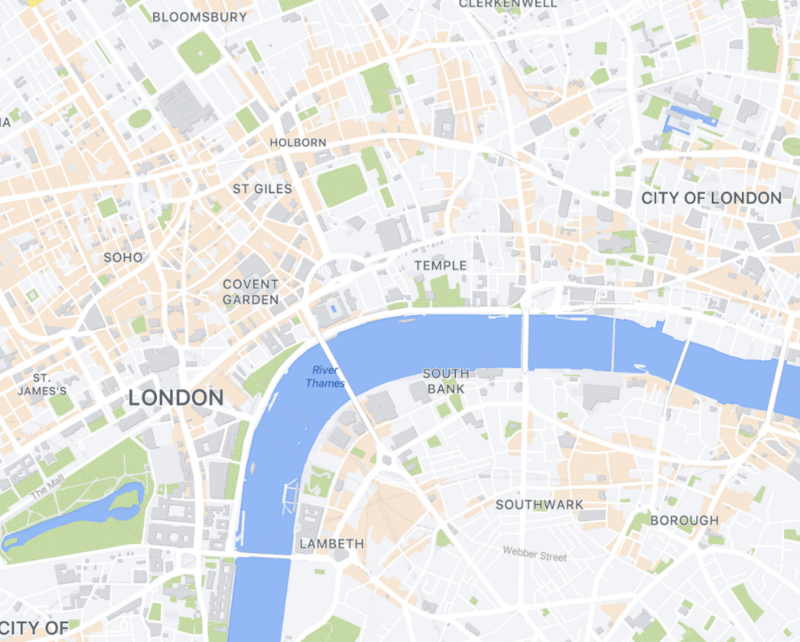
Given the purpose of the map, we wanted the cartographic aesthetic to be fun, engaging and have a Facebook look and feel. We aligned, where we could, our colors with those available in Facebook’s established color system. In doing so, the map sits more seamlessly inside of the larger product experience. The colors we chose for land, water and place labels immediately gives the map a Facebook aesthetic.
At larger scales (more zoomed in), the colors we chose from this system for different land use types are desaturated and bright, giving the map a friendly and welcoming tone to highlight important landmarks and areas.
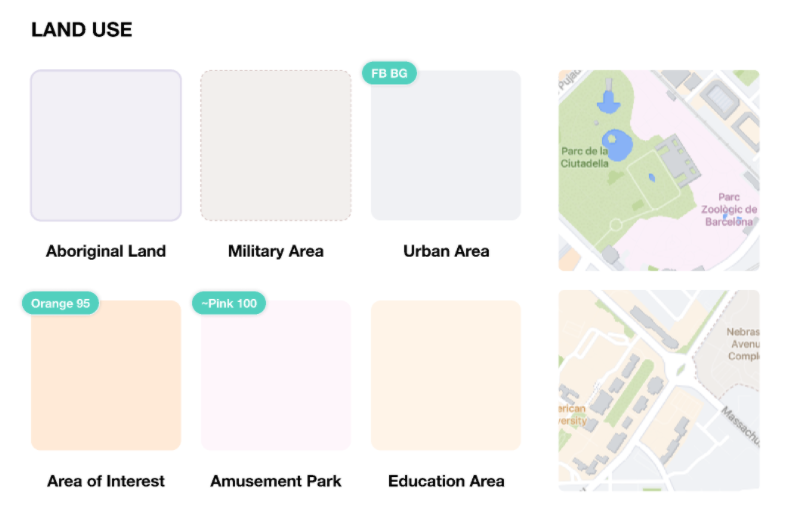
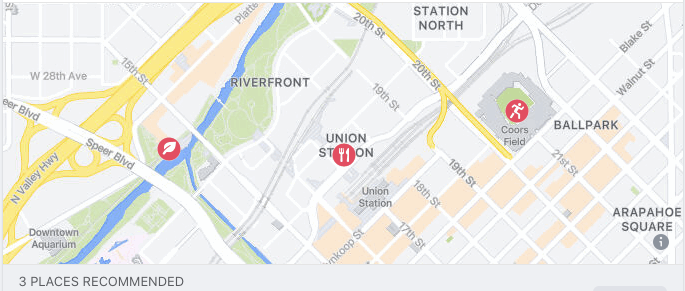
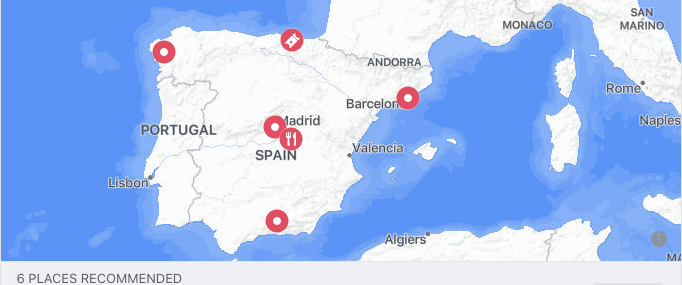
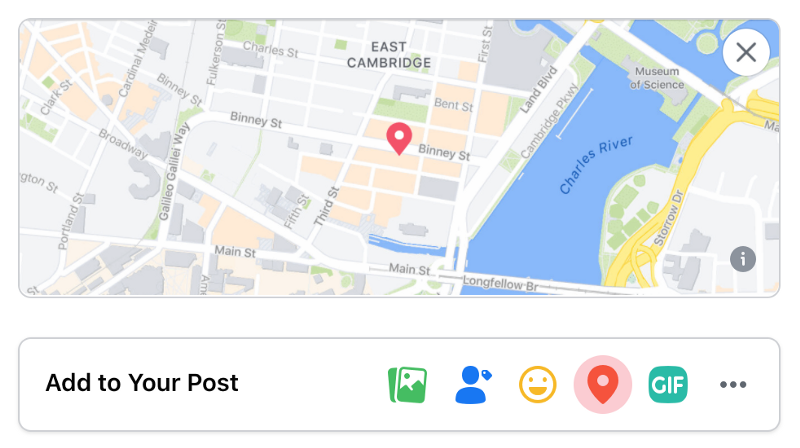
You may notice that our map doesn’t include any icons for points of interest, as you might expect from a normal web map. That’s because the map is intended to be a foundation for marker layers that will be placed dynamically based on how the map is being used, whether for recommendations, local search, or any number of future uses. Our base map design with pale colors and no icons allows overlaid social layers that use more saturated colors to come to the foreground.
Cartographic Effects
Another part of our design work has been exploring novel ways to bring traditional cartographic effects to the Facebook Map, like hill shade and water vignettes. These elements are often subtle, but they add an important feeling of depth and richness to the map.
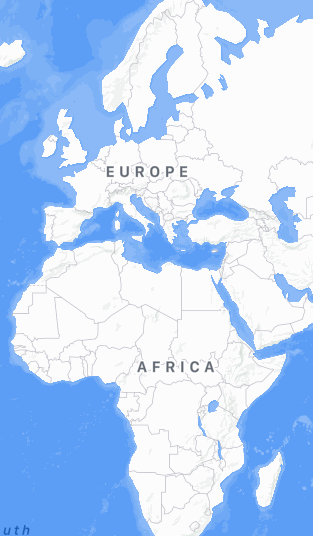
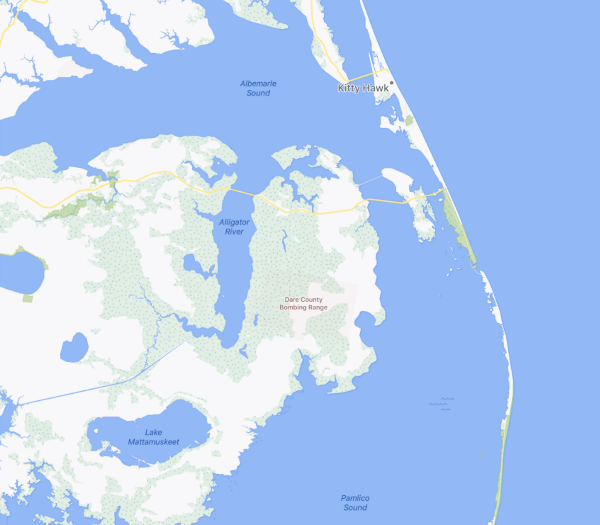
Adding soft indications of shadows caused by mountain ranges (known as “hill shades”) gives the map more richness and texture, especially at continent-level zooms where it would otherwise feel fairly empty. As you zoom in from a world-wide scale down to a regional scale, we progressively add more hill shade detail — just enough resolution at each zoom level to prevent the map from looking too noisy. This multi-scale vectorized hill shade was created using raster sources from Natural Earth and customized for the aesthetic of this map.
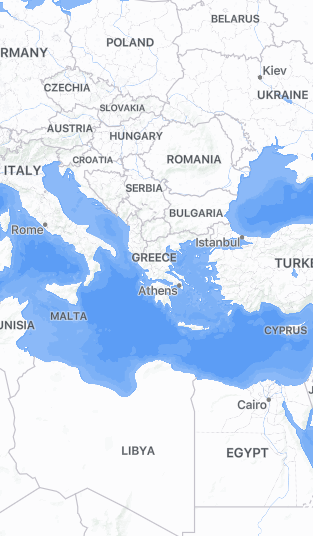
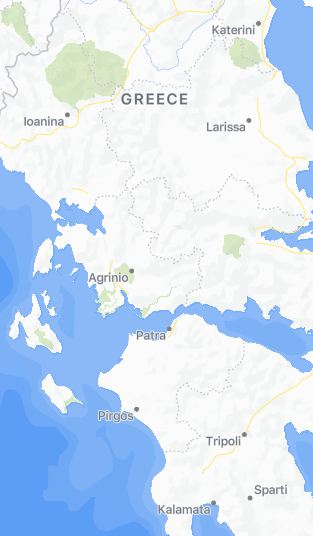
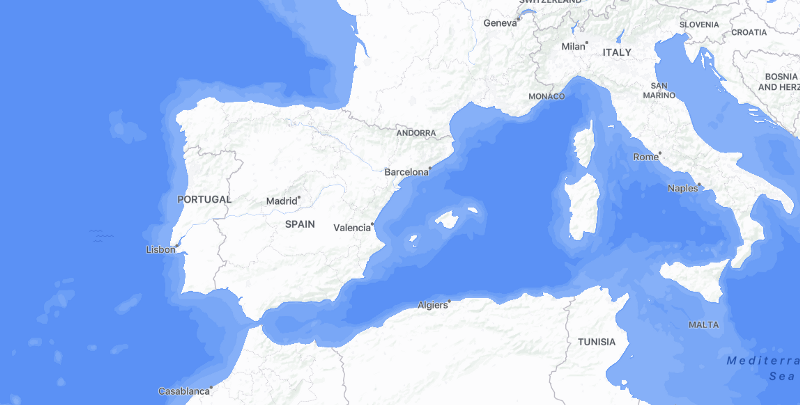
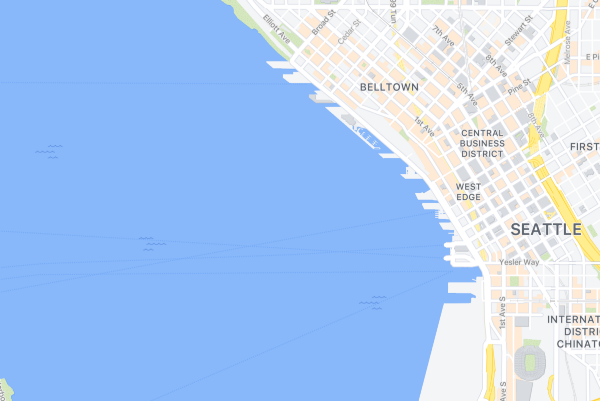
To give a subtle drop shadow around the edges of all water areas, such as oceans, lakes, and wide rivers, we generate outlines along the lower right edge of the coastline. These vignettes are carefully constructed polygons designed to give the impression as though the land around the edge of a water feature is slightly extruded from the surface of the map. This playful effect gives the map a tactile sense of depth and physicality. You have to look close to see it, but we think it was worth the extra effort to do it right. Here’s a scaled-up screenshot of a bit of the coastline so you can see the effect in more detail:
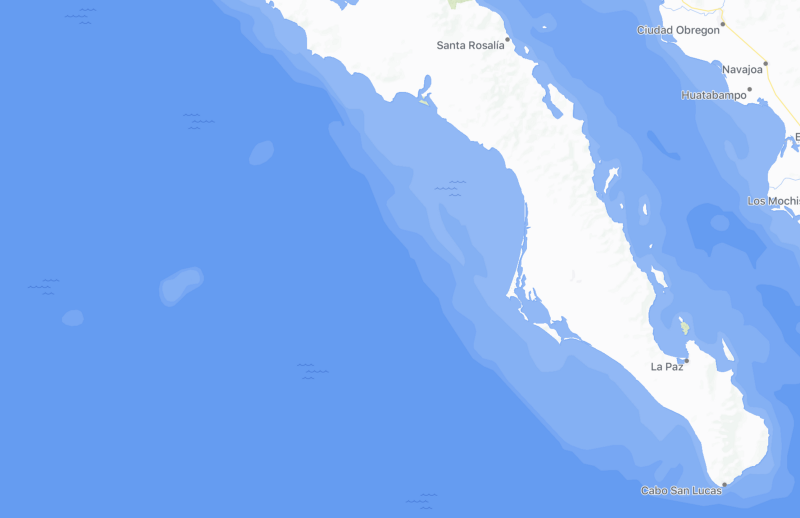
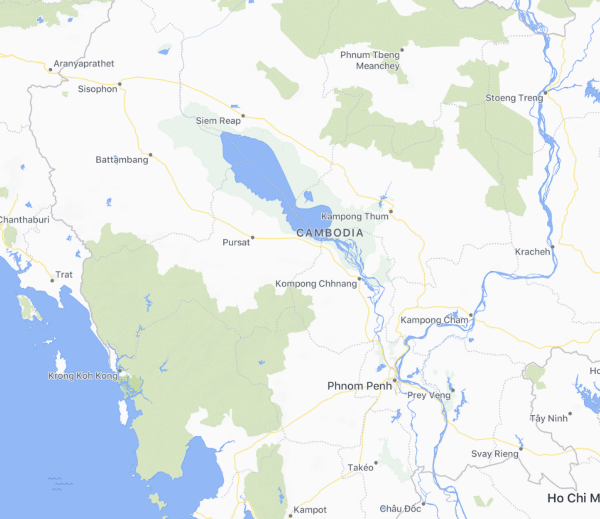
Combining code, math, and randomness, waves icons are placed throughout the map with careful consideration to avoid collisions with land areas and bathymetry contours.
Choosing what to emphasize on the map
The map’s goal is to inspire people to make in-person connections, explore their surroundings, and have experiences in the real world. Of course, during the global pandemic, people should avoid crowded places and gatherings where it may be difficult to stay at least six feet away from others, but once it’s safe to gather again, this map will be there waiting!
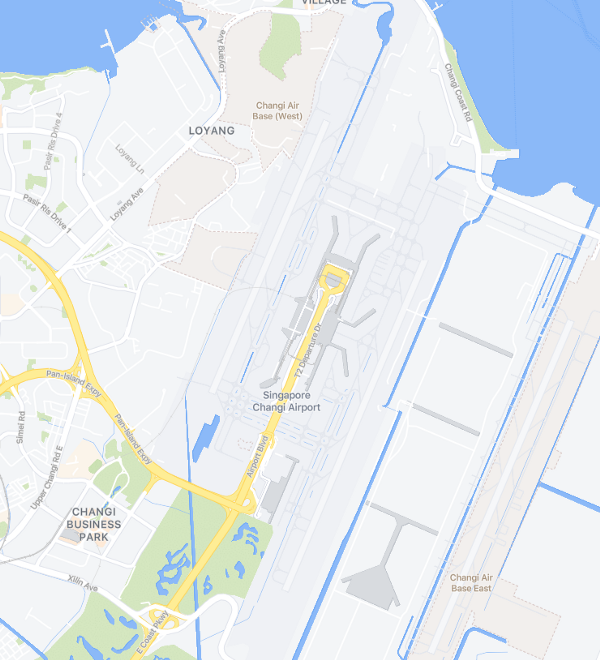
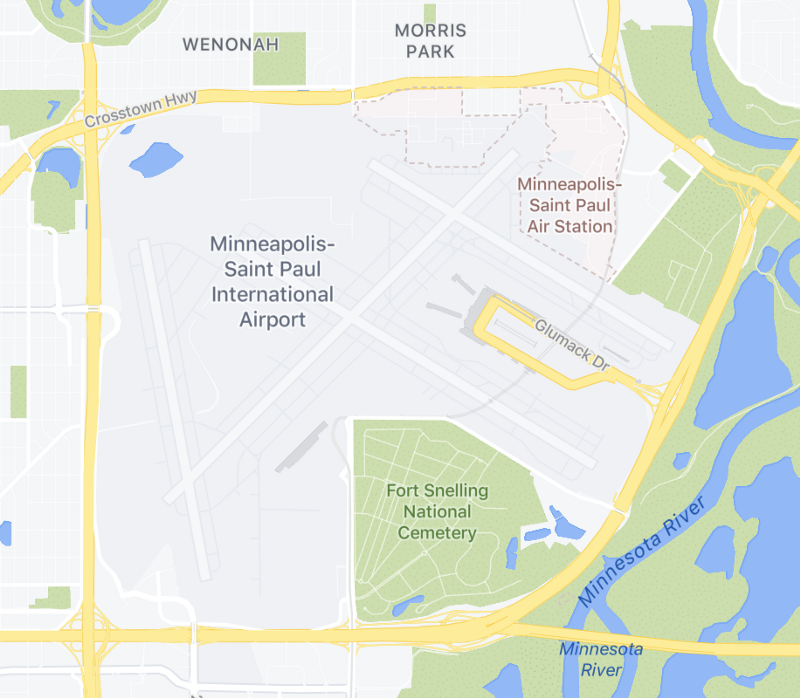
Places important for travel: we made sure that airports are well mapped…
Places for gathering: parks, commercial districts, museums and landmarks…
Places on foot: our map is not designed as a car navigation map. Instead, we emphasize pedestrian infrastructure like sidewalks, trails, and town squares…
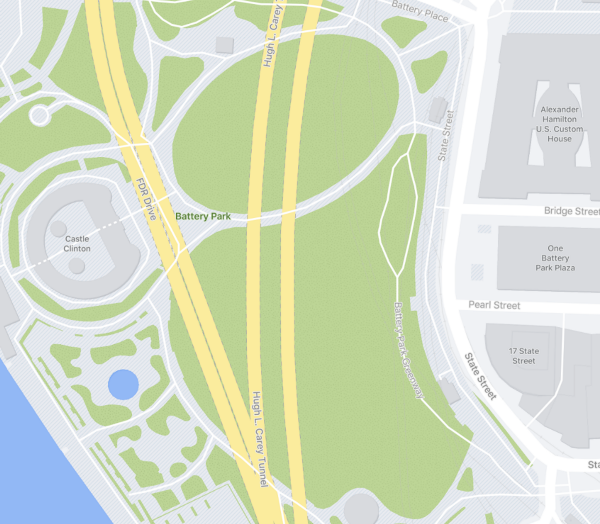
Natural features emphasized over political ones: this is not a political reference map, so we de-emphasize borders and country and state names, and give extra emphasis to parks, wetlands, and other natural areas…
Where You Can See The Map
The Facebook map is accessible across most mobile devices and browsers. (The main exception is that iOS users will still see Apple Maps for now, although these users can pull up a web browser if they’d like to explore our new map). Modern devices that support WebGL technologies are provided with vector tile based maps, while older devices are served raster based maps. We generate the raster maps using a server-side process that effectively takes a snapshot of the rendered vector maps; this approach dramatically streamlined our map design process, meaning that we only needed to develop a single map development workflow, rather than supporting two separate systems for generating both vector and raster maps. To the end user, the result is raster maps that look indistinguishable from their more interactive vector-based siblings. Both of these maps are synced and refreshed on a regular basis to provide an integrated, rich experience regardless of your device.
What’s Next
This map is only the beginning! There’s still a lot of work to do as we continue to improve this map, keeping it up to date with physical changes out in the real world, and also refining how it looks as we learn more about how it is used across Facebook’s many surfaces. That means expanding into more styles, including dark mode, to support the dark mode Facebook interface that launched last year.
We’re also thinking of this project as less like a single map style, and more like a flexible cartographic system that can support many different map variants and the wide array of uses for maps across the platform. Stay tuned to see how this map evolves as it shows up across more and more places on Facebook!
Thanks
Huge thanks to Facebook’s Vladimir Gluzman Peregrine and our own Stephanie May who gave an excellent presentation on this map at the North American Cartographic Information Society conference back in October 2020, which provided the basis for this post. If you want to learn more, definitely go watch the recording of their presentation!
Thanks also to the numerous team members on the Stamen side who worked on various phases of this effort. As the project moved from architecting on to building and then finally to refinement, we could rely on an ever-evolving cast of all-stars who brought their unique talents to the project. On the team: Jonah Adkins, Mamata Akella, Dana Bauer, Alec Burch, Brett Camper, Seth Fitzsimmons, Katie Kowalsky, Stephanie May, Alan McConchie, Gretchen Peterson, Jim Stanley, and Ross Thorn.
Are you ready for an updated, customized basemap for your business or non-profit? To find out how we can help you use open data to create a map that’s perfectly tailored to your unique use case, get in touch!