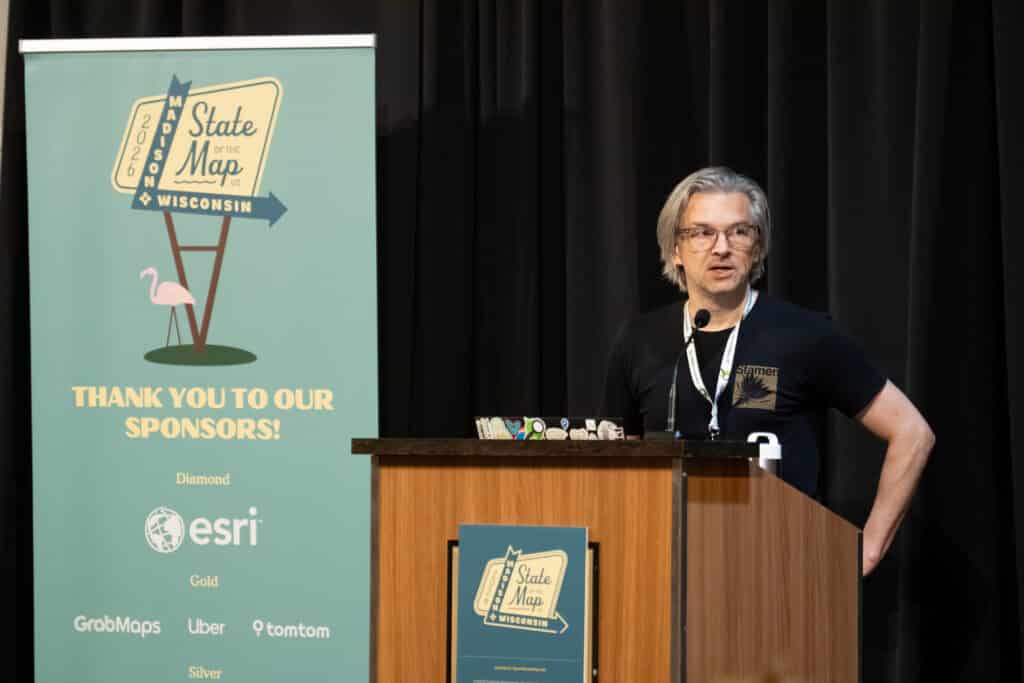
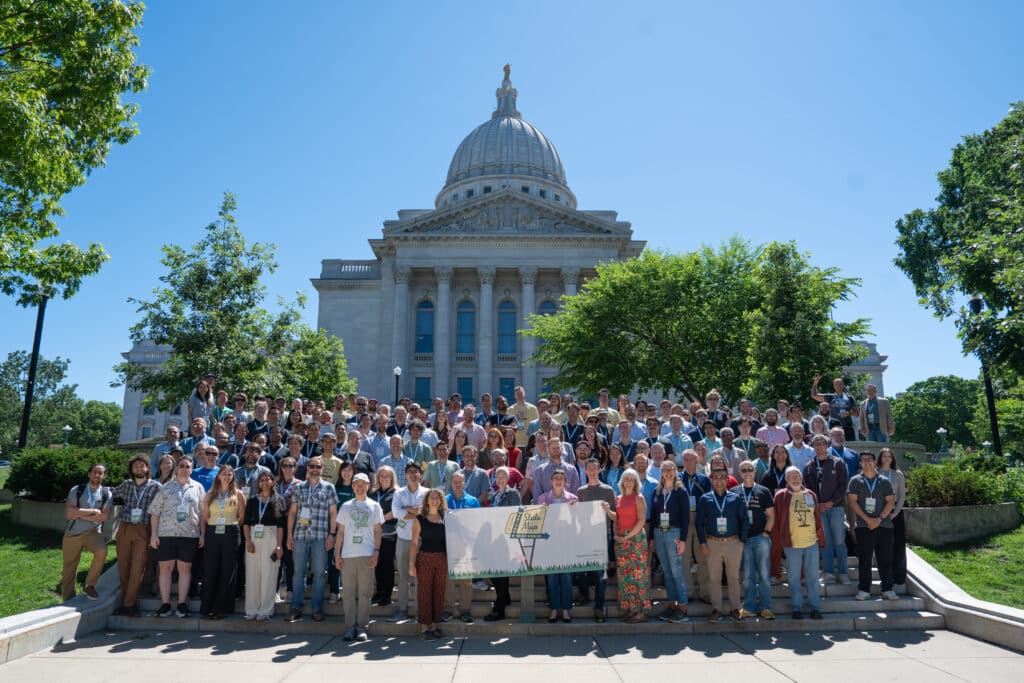
The State of the Map US (SOTMUS) 2026 conference in Madison, WI was yet another fantastic gathering of cartographers, mappers, and map enthusiasts, of new friends and familiar faces. I had the chance to give two talks on behalf of Stamen — one about a community research project, and one that was a lot more personal. Now that we’re nearing the end of summer, I wanted to share some of the highlights from our time in Madison and review the recordings of some of our favorite presentations.
State of the OSM cartography landscape
Stamen’s first talk was meant to be a co-presentation with my colleague Kelsey Taylor, but unfortunately the storms that were causing cancelled flights all across the country that week meant that she and many other planned attendees couldn’t make it to Madison. (Kelsey was also scheduled to give a third presentation about mapping urban wildlife which had to be canceled, although you can read her blog post version of that project coming soon).
This presentation was a review of a research project Stamen ran with the broader OpenStreetMap community: a census of the tools, data sources, and workflows people use to make maps. We originally planned a much narrower survey, focused just on maps designed with OpenStreetMap data, but we ended up broadening the concept to include any kind of map design and to look at the whole process from data collection and management, through design and production, and integration and deployment of maps online.
At Stamen we have built a lot of custom open source tools to support our team as we design and maintain complex map stylesheets, and we are always looking for ways to improve these tools and to make them more useful to the wider cartography community. We had 69 respondents share what tools they use, what’s working, what isn’t, and where they wish there was more investment — from data sources and preview tools to processing environments.
We divided the survey questions into three main categories covering data processing, cartographic styling, and web development. In the first section on “data”, the responses showed a continued move from proprietary to open source tooling and data sources, growing interest in automating data fetching and processing (including with scripting and LLMs), and raster data remaining a persistent pain point in terms of both size and resolution. QA of data (and checking the resulting styles) remains a difficult task that is hard to scale across the global basemaps we are often working with.

In the second section on cartographic styling, we also saw lots of interest in automating or scripting parts of the process, and to incorporate more non-GUI tools. Still, there are many parts of the process that are manual or need manual refinement, which is itself not a bad thing, but many respondents complained that too much of the manual work is tedious. It seems like building tools that still support that human touch but relive some of the drudgery would be a welcome addition.

In the third section on development, we asked a lot of questions about data formats (raster vs vector, tiled or not) and concerns about QA and in particular the difficulty of real-world testing came up a lot. Performance testing with maps, for example, is hard to do well, especially on mobile. The cost of serving web maps was also a concern for many of our respondents, leading them to choose more complicated setups even if it meant de-prioritizing support options or sacrificing compatibility.

I won’t go into too much more detail about our findings in this post, as we are still planning on publishing a deeper dive into these results sometime later this year. Stay tuned for that, but in the meantime you can watch the recording of the presentation on YouTube here.
Mapping totem poles in OpenStreetMap with a 5-year-old cartographer-in-training
My second talk was a bit different — inspired by my five-year-old son, whose special interest is outdoor sculpture and totem poles.

The talk started as a personal story of getting a child interested in OpenStreetMap as a way to learn about the world and get excited about going outside and visiting new places. But it also included some generally applicable observations about how the OpenStreetMap community decides what to map and how to map it and the various ways that we all collaboratively create a detailed and meaningful map of the world together.
Finding the right OpenStreetMap tags
We live in Bellingham, WA, and we spend a lot of time visiting totem poles around the Pacific Northwest and British Columbia. For those of you who are not familiar with this area, you may be surprised that totem poles are far from being a historical artifact of the past found only in museums: indigenous people are still carving totem poles to this day, and they can be found in many parks, schools, and public buildings in our region. These public totem poles are often placed as a process of reconciliation (or at least, hopefully, to support understanding) between the settler culture (which I am a part of) and the indigenous cultures of the region. Naturally, as my son learned more about totem poles, he became interested in visiting more and more of them in our area. So, of course we checked a map.
When I went looking for totem poles in OpenStreetMap, I found that many of the ones we had already visited simply didn’t exist in the database yet, and the ones that did had wildly inconsistent tags. OpenStreetMap’s tagging system is a folksonomy — it’s grown organically, bottom-up, and anyone can edit it — which is powerful, but it also means the same real-world object can end up tagged four different ways by four different well-meaning mappers.
In the presentation I pulled up four real totem pole nodes from OSM to show just how scattered the tagging had become: some using tourism=artwork combined with artwork_type=carving, others man_made=totem_pole, others monument=totem_pole, and others tourism=artwork with artwork_type=totem_pole. Finding — or building — consensus on a single tagging scheme turned out to be a big part of the talk.

Each of these possible tags has its pros and cons. However, it’s also not clear whether any of these proposals make sense to have a single “totem pole” tag, since that term doesn’t originate from the native community and these large carvings might be called “story poles” or “house posts” or “welcome figures” (as just a few examples we’ve encountered in our area) depending on their purpose and the specific indigenous culture they come from. Wikipedia’s article on totem poles lists several of these types of pole and their different meanings, and in the discussion section on that article, people note that many indigenous communities and some prominent museums specifically avoid using the term “totem pole” entirely. Whether there is a single term like “totem pole” that we could use as an alternative in all of these situations is an open question. The discussion in the OpenStreetMap community is still ongoing, and we are also looking for more input from members of native communities in the US and Canada about what terminology makes sense for them.

One of the important things about OpenStreetMap is that we can continue mapping even while these tagging discussions are working themselves out: we can always update the tags later, and in many ways the act of going out and trying to map the world is an important part of the process to inform the decisions about what tagging is relevant and meaningful.
Collecting street-level imagery
The fieldwork side of this was its own adventure. When visiting a totem pole we found in OpenStreetmap (or adding one to the database if it wasn’t there already) we’d take a note of the name of the pole and the person who carved it, if that information was on a plaque near the pole. Sometimes we’d add other information like the date it was carved, the height, the direction the pole is facing, the material (usually but not always Western Red Cedar) and so on; the list of possible attributes you can add in OSM is open-ended, but there’s a good list of suggested tags on the OSM wiki.
But we also wanted to take pictures (but again, emphasizing that we are only visiting poles that are in public places like parks, civic buildings, and museums). While OSM itself doesn’t support pictures, we can upload our own photos to Mapillary (which is like an open-source version of Google StreetView) to help other OpenStreetMap contributors add additional information.
To collect street-level imagery for these poles, we used a 360° camera mounted on a telescoping pole — held up by a shoulder-mounted 5-year-old, who turned out to be a surprisingly steady camera rig. Here is our sequence of photos from when we visited a totem pole (OSM node 13932682112) in Minoru Park in Richmond, BC: (Mapillary link)

Linking to Wikipedia
The last piece was connecting all of this to Wikidata and Wikimedia Commons (sister projects to Wikipedia). Like with Mapillary, this part of the process is optional: adding information to OpenStreetMap is sufficient but adding links to the much larger Wikimedia ecosystem not only helps OSM data be discovered by more people, but can add more structure and context to the things we map in OSM, and include information that doesn’t fit into the OSM data model. In particular, I started using Wikimedia Commons as a place to upload higher-resolution photos (better detail than in the Mapillary panoramas) since OSM doesn’t have built-in photo storage.
But soon this led down a fascinating Wikimedia and Wikidata rabbit-hole: Simple OSM tags like wikimedia_commons=* work fine for linking a single photo, but once you want to attach multiple images to one totem pole — say, a photo of the pole itself and a photo of its interpretive plaque — you need to create a Wikidata item and link to it from OSM with wikidata=*. That Wikidata item can then point to as many Wikimedia Commons images as you want, which opens the door to richer documentation of each pole over time. As an example, here is the New Westminster Centennial Totem Pole in OSM (node 10122945656), which links to a separate entry for the pole on Wikidata (id=Q138899364).
We can also link to Wikipedia articles about the carvers to created these totem poles, using the OSM tag artist:wikidata=*, providing much more information than simply adding the carver’s name in the OSM “artist” field. For example, we can link to Musqueam artist Susan Point via her wikidata item Q16151913, making it easier to search for any of her totem poles in OSM. Using machine-readable Wikidata IDs also makes it easier to translate names and tags across multiple languages.
As someone who has been contributing to OpenStreetMap for decades, the many possibilities of connecting OSM and Wikipedia has been a delightful new discovery for me.

An ongoing process
As I mentioned earlier, this mapping project is a work in progress, and an ongoing learning process for myself and for my son. Hopefully the OpenStreetMap community will come to some consensus about which tags to use, and as that happens I hope to write better instructions for others to help map totem poles in their own area. But what is also important to be clear about is what is not for us to do, and what is best left to others. As non-indigenous people we can map these poles when they are public, and document what we observe, but the stories of what these totem poles mean is not for us to tell or share. There is much we can learn about what stories these poles are telling, but writing that down probably doesn’t belong in OpenStreetMap, and we are not the ones to write it.

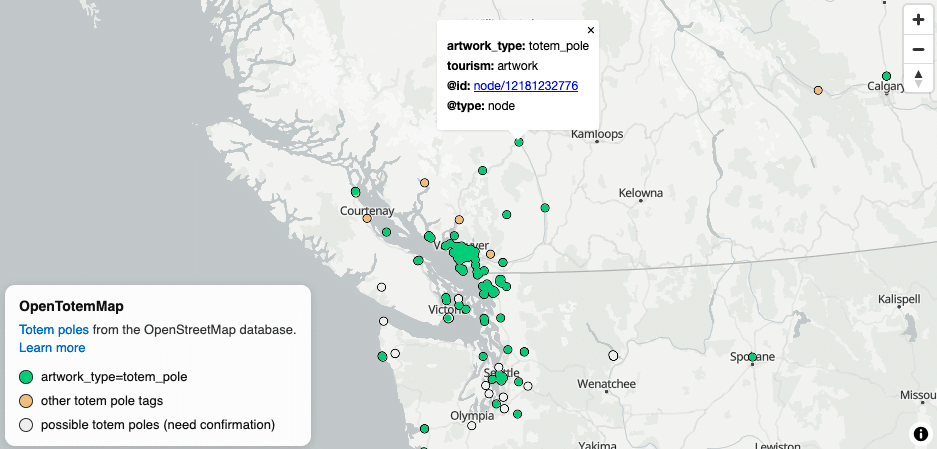
There’s no video for this presentation (sorry!) but I’m sure I will be writing more on this topic in the future as the discussions about mapping totem poles evolve with input from the OSM contributors and the indigenous community. For now, I invite you to visit the discussion page on the OpenStreetMap Wiki, which will continue to be updated as we figure out the most appropriate way for mapping these objects. You can also browse a map on my experimental “Open Totem Map” which shows dots for any entities in OpenStreetMap that might be totem poles, based on their tags or the name of the feature.
Other memorable presentations
As with all State of the Map conferences, there were too many great presentations to pick just a few favorites. Those that I am specifically going back to rewatch had interesting resonances with our own talks:
Related to our cartography landscape survey:
We always enjoy hearing Yuri Astrakhan give updates about the state of the MapLibre open source map renderer project, which is always rolling out impressive new features at every conference. His talk “MapLibre Tiles — next generation tiles and other MapLibre news” did not disappoint. MapLibre sits at the center of Stamen’s own map stack, and it enables so many of the various interchangeable map design tools we were asking people about in our survey. Yuri ended his talk with a rousing call to action about how big tech companies need to be better about funding the open source projects they depend on, including suggestions for how open source organizations can make it easier for them to donate.
“Contributing with an Open Source Toolchain” by Devon Hanbey was a fascinating presentation exploring how to piece together a workflow for contributing to OpenStreetMap using absolutely nothing but open source software, a surprisingly challenging task. Devon’s talk covered many tools that didn’t overlap with our cartography landscape survey because it was focused on contributing information to OSM rather than making maps with OSM data. Overall, I appreciated Devon’s rigorous interrogation of all the tools in a typical mapping toolchain, assessing why each one is needed and whether there is a better tool for the job, something we aspire to do with our own design workflows.
Related to our totem pole mapping talk:
There were two important presentations about mapping indigenous topics, first was “Engaging with the Local Landscape: The Story of Mapping Teejop” by Gareth Baldrica-Franklin, the conference keynote. This presentation shared the process of creating walking tours to explore Teejop, the Ho-Chunk name for the Madison area, as a way to learn about the often overlooked indigenous history of the area. A second presentation, “Community mapping, data sovereignty and Indigenous toponyms on OSM” by Emily Jacobi, addressed the other side of the coin: when mapping indigenous knowledge is not meant to be shared as widely as possible, when the information itself may be sensitive and kept within the community, or shared strategically under the control of the indigenous community themselves for the purposes of defending their legal right to their own territory. Both of these presentations spoke thoughtfully to exactly the questions we were sitting with about whose story totem poles are to tell, and how to map indigenous culture and place respectfully, especially as a non-indigenous person.
Related to other aspects of my presentation, I enjoyed “Wikimedia Enterprise — Lessons Learned” by Lane Becker & Mike Migurski, which included even more possible ways to link Wikidata and Wikimedia Commons with OpenStreetMap, including connections to Wikitravel, using Wikipedia article length to rank importance of features in OSM for better rendering, and more. Lane also shared some interesting perspective from inside the Wikimedia organization about their efforts to deal with the increasingly heavy server traffic caused by large corporations (and LLMs in particular) using their services, with some ideas about how OpenStreetMap could deal with some of the same challenges it faces.
“OSM-lish: OpenStreetMap’s Own English Dialect” from Clay Smalley was a fun look at the community jargon and shorthand that builds up inside a folksonomy like OSM. The tag names we use in OSM are a bizarre hodge-podge of terminology drawn from various dialects of English (mostly British English) and from miscellaneous specialized technical fields, but transformed through years of linguistic drift: as new tags get added or mapping consensus evolves, the meaning of old tags often shifts in unusual ways. This talk really resonated with me regarding the difficulty of figuring out the right terminology to use for mapping totem poles, underlining the conclusion that there may not be any perfect tag that will make sense for everyone in all situations.
Related to other past Stamen projects:
I also want to mention a few presentations from current or previous Stamen clients, or that had connections to past Stamen work. In recent years we’ve done work with the maps team at Amazon, in particular designing the basemaps used in AWS Location Services, and I was very interested by a presentation from another Amazon team “How Amazon Generates Map Tiles for Last-Mile Delivery” by Vishal Kumar & Shaishav Maisuria. This extremely technical talk gave a detailed overview of how to generate and maintain up-to-date map tiles for OSM as affordably and efficiently as possible. It’s impressive how powerful the OSM tiling tools are these days, and this example also showed how you can make even more efficiency gains by optimizing your tiles for a specific use case (in this case, last mile delivery routing) rather than relying on off-the-shelf tiles and schemas.
I also enjoyed Parth Vyas and Brian Spencer’s talk “Mapping with Restraint: How Lyft leverages and contributes to the OSM Community”. A few years back we got to work with the Lyft team on the design of their maps, and we love to see that they’ve continued to deepen their connection with the OpenStreetMap community and to contribute their efforts to keep the OSM data up to date for everyone. Lyft is a great example of how to build a business that relies on OpenStreetMap but still recognizes that OSM is a large, preexisting community that should be treated with respect, and a shared resource that needs to be maintained for the benefit of all.
Finally, from Daniel Krol & Jacob Chapman “State of OpenStreetMap on Internet-in-a-Box” was a talk about a very different end of the mapping spectrum: far from big tech companies handling minute-by-minute updates of massive datasets, this talk was about including extracts of OSM in offline educational computers in low bandwidth or fully off-the-grid schools in villages around the world. This one took us right back to our own long-ago work on the Portable OpenStreetMap project, making our Field Papers tool work offline. Internet-in-a-Box and Portable OpenStreetMap had slightly different goals, but the same aspiration of using OSM to make information more accessible to everyone in the world, no matter where they live.
Until next time
We’re always excited to spend time with the OSM community, and are looking forward to the upcoming announcements for the location of next year’s conference. Until then, we will also be presenting some other new mappy work at the upcoming North American Cartographic Information Society (NACIS) conference coming up in October of this year.
We hope to see you there!