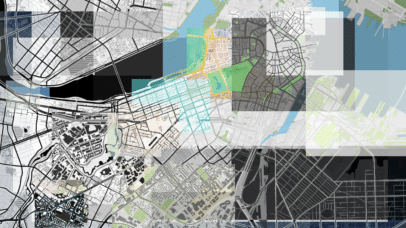
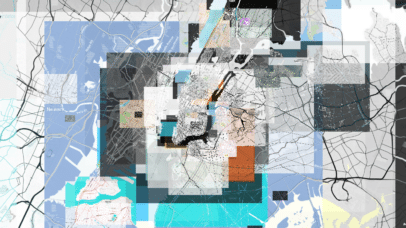
Stamen’s Dark (Map) Materials

We’ve made a lot of dark maps over the years at Stamen. We’ll often see dark maps from other designers or commercial providers and think, “why so dark?” We have a philosophy around designing a dark map for a particular client or use case, but we haven’t ever really spelled it out – either internally...

What We Map in the Shadows

Dark greetings! We’ve been thinking a lot about dark maps in recent months (as Kelsey presented about recently at NACIS) and the thought occurred to us: how quickly could we make a nice dark mode version of Stamen’s iconic Toner style?  As you may recall, a couple years ago we created vectorized versions of our...

Data visualization and mapping for a scientific audience with USGS Midwest Climate Adaptation Science Center’s Summer Symposium

| 09.04.25

Last month, I led an interactive workshop at The Midwest Climate Adaptation Science Center’s Summer Symposium at the University of Illinois Urbana-Champaign in Urbana, Illinois. MW CASC is a consortium of research-focused academic, Tribal, and non-profit partners working collaboratively with the United States Geological Survey (USGS).  The workshop focused on data visualization and mapping for...

Navigate your city car-free with MetroMatch

| 08.15.25

Earlier this summer, Stamen collaborated with the team at MetroMatch to update the look and feel of their transit-first navigation tool.  MetroMatch is a transit-focused travel planning and discovery site that connects travelers to destinations that are only a short walk from rail stations. MetroMatch’s pilot focuses on Washington, DC, taking advantage of the region’s...

Stamen at State of the Map US 2025

The State of the Map US (SOTMUS) 2025 conference in Boston, MA was yet another fantastic gathering of cartographers, mappers, and map enthusiasts. Stamen was well-represented this year by Kelsey Taylor, Eric Brelsford, and Eric Rodenbeck. We presented two talks on Stamen projects related to open source tooling with maps. Now that we’re back in...

Farewell, Map Stack

| 06.16.25

Stamen is officially retiring Map Stack, a platform we previously hosted that gave everyone a straightforward way to mix and modify raster base maps. What was Map Stack? Created in 2013, Map Stack gave you an interface where you could select from a variety of raster base maps, tweak the images that made up the...

Debugging 101 with Stamen Carto Tools (and other tools we like)

| 04.30.25

In vector cartography, the map is only as good as the data that powers it. If we don’t understand what’s going on in the underlying data, we’re pretty limited in our cartographic approach. A major part of this work involves parsing vector tile data, determining how one dataset compares to another, and diagnosing bugs encountered...

Navigating polarized views of AI in the immersive museum exhibit ‘The Connection Engine’

| 03.25.25

What is the Connection Engine? The Congruence Engine (later renamed Connection Engine) is a three-year research project funded by the Arts and Humanities Research Council in efforts to digitally connect industrial heritage collections across the UK. Using advanced digital tools such as AI, it links museum objects, archives, photographs, and more, enabling historians and curators...

Taking UCSF’s Health Atlas National

Stamen has been working with a team out of UCSF (University of San Francisco) Population Health and Health Equity to create and maintain their Health Atlas since 2019. You can read a bit about the initial launch in our blog post from 2020. In 2024 we had the opportunity to rebuild the Health Atlas and...

Vector Beeswarm Dot Density with Mapping Historical New York

| 02.07.25

Stamen has had the pleasure of developing Mapping Historical New York with Columbia’s Center for Spatial Research since 2021. We’ve written about it a few times, including most recently last fall, but here we wanted to expand on the technical implementation behind one layer on the map. The map displays census data in New York...