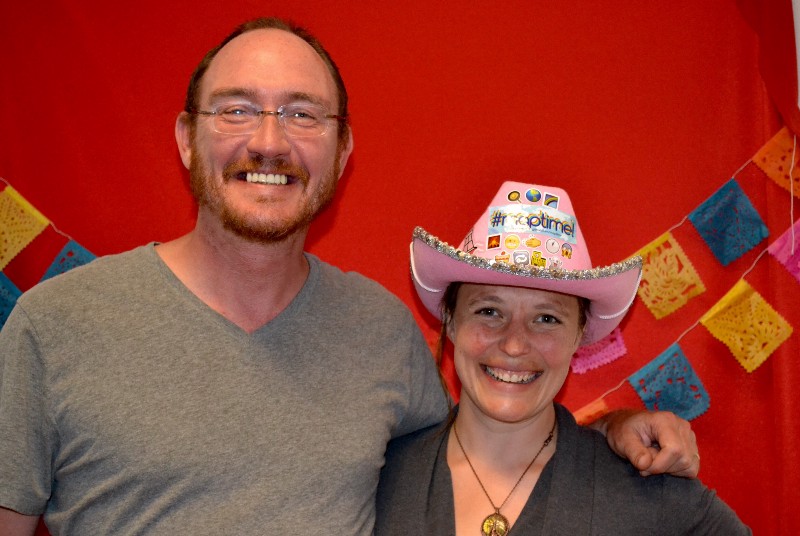
Last week I sat down with the amazing Zan Armstrong, who I’ve had the pleasure of working closely with over the last six months. She’s heading out on a world tour, so I wanted to get a sense from her what she’d learned from working with us, how she felt about the projects, and what I could do better.
ERIC RODENBECK So what were you doing before working with Stamen? I’m trying to remember. I think you were at Google doing analytics?
ZAN ARMSTRONG The quick history of my life: I was a high school math teacher for a couple of years, studied bioinformatics in Sweden, moved to California not knowing what I was doing with my life, and managed to land fortunately at Google. I was there for six years mostly doing revenue forecasting and analysis. And that was really what brought me to data visualization. I took a class there by Cole Nussbaumer who has a “Story Telling with Data” blog , and was super inspired, and I thought: “This is amazing, data viz is the best.” And started incorporating it into my work just in Excel, and then in R, and then I realized I really wanted to do more of this. I spent six months with Google’s data viz team led by Fernanda Viégas & Martin Wattenberg, did some research with them, had an amazing amazing experience and realized about how much knowing your tools makes a difference. I took about a year, just on my own, left Google, gave myself a year to learn as much as I could about d3 and JavaScript.
ERIC That’s how you met Kai, probably.
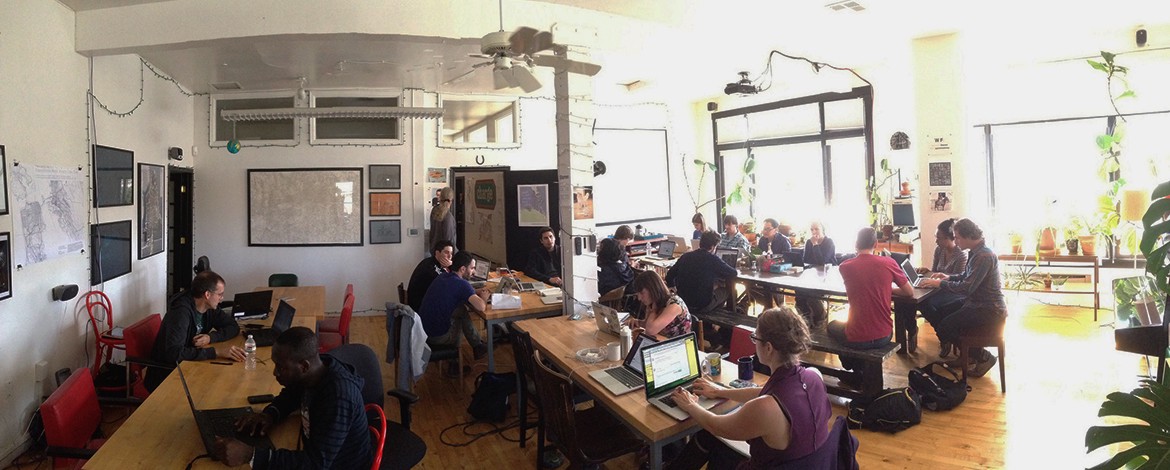
ZAN I met Kai Chang, who’s done a bunch of work with Stamen. through the D3 community. That community in San Francisco is super fantastic, super encouraging. I got to know Kai at Maptime. I’d actually been to some Maptimes before, so I got to know Stamen through Maptime originally. I remember actually it was right after I left Google that I came to my first Maptime, when I walked in it was like, “I want to be in an office like this. There’s plants and there’s light, and there’s happy people in the middle of the city.” And there’s maps on every wall. It felt like this is the place to be. So I kind of had Stamen on my radar screen for a while. Then I started doing some freelancing in data viz, and then Kai said that I should come to lunch and made the connection, and it’s been a super fun six months here.
ERIC What I’m picking up from what you’re saying is that the social events that we do are really important as far as getting out in front of the right kind of people.
ZAN Yeah, definitely. I think Stamen has a great reputation but it really was coming into the office and meeting Beth and meeting Alan and seeing the kind of place and energy that it made it feel at home and easy to take the next step.
ERIC It makes me think that we should throw more happy hours! [laughter]. So the first project you worked on with us was the National Geographic Amazonia project?
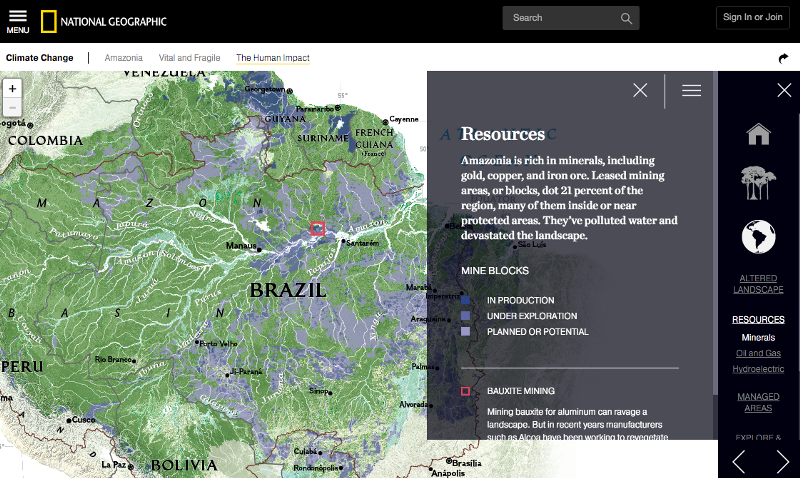
ZAN That was an interesting project. Coming in on a project that was essentially complete, and then there was an ask to build off of that to create these different pages that all were a map of the Amazon basin with different data about resource use, and what people were doing with the land, whether they were living there, indigenous resources, potential resources, infrastructure. National Geographic asked for us to put everything on one page, so people could explore and compare it. It was an interesting challenge because so much had already been decided. So getting to leverage all the great work that had already been used, and buildup of that, but also the challenge of there was limits in terms of what I could do in terms of how to make everything look good together when things hadn’t ever been designed to be overlapping.
ERIC That was the big challenge though, right? Adapting this sort of — I think we called it a map with sliders that doesn’t suck, right? [laughter]. Because you just see these kinds of maps all over the place, these generic throw-a bunch-of-data-layers-on a map and you let people adjust their opacity and that’s somehow supposed to lead to insight automatically. And it just doesn’t.
ZAN I think that project was all about small decisions. Starting with everything off, instead of everything on, so people could add on collecting things by themes that were meant to go together and just a lot of tiny decisions that made a difference in the experience.
ERIC Paying attention to detail, I guess —
ZAN Yeah, and it was amazing to build off of a fantastic project to start with [chuckles].
ERIC Right. Any challenges in that that you had to overcome or that you needed to figure out?
ZAN First of all just it was a code base that was already built and there had been a number of decisions that were made for various reasons. So both looking on the design side and the technology side, getting the advantage of coming into something that’s already built but also the challenges and constraints of adapting to the system that’s already built.
ERIC And the other work you’ve done has not been like that one?
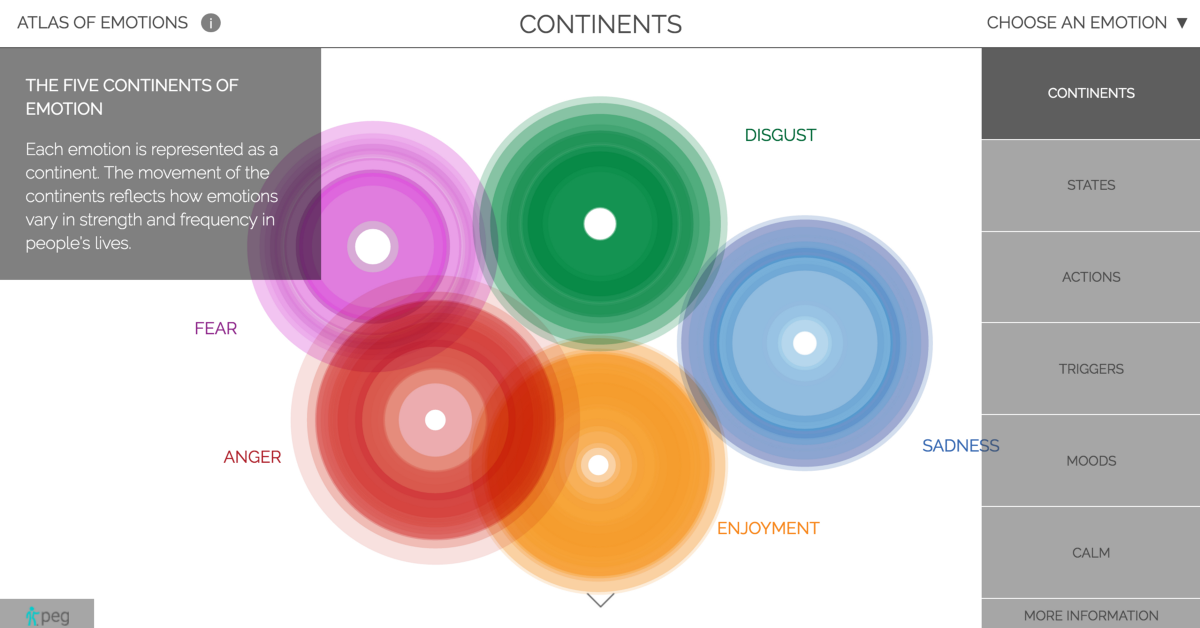
ZAN On the Atlas of Emotions, I came on at the end of that project as well, but, unlike the National Geographic project, it was still pre-launch. Everything that we were doing had been conceived as part of the project. So it wasn’t this new thing that hadn’t a part of the original design. The interesting challenge with Atlas were taking Nicolette’s concepts from Illustrator, and figuring out some of the algorithms to actually put those into practice.
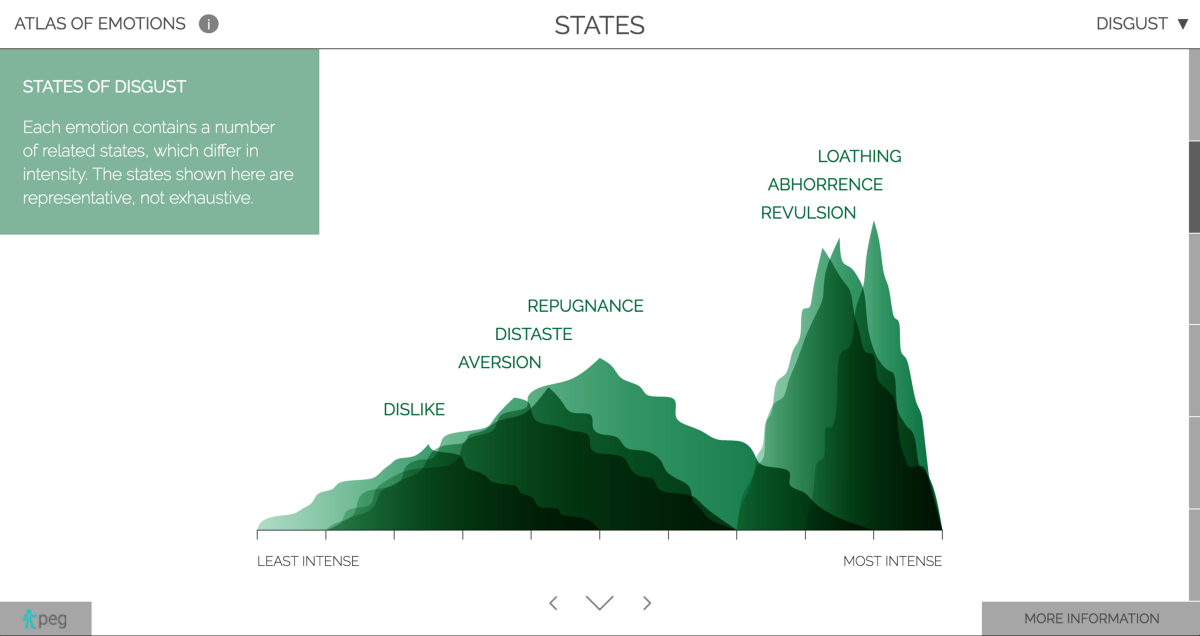
ERIC You were doing things like generatively build the lines of disgust.
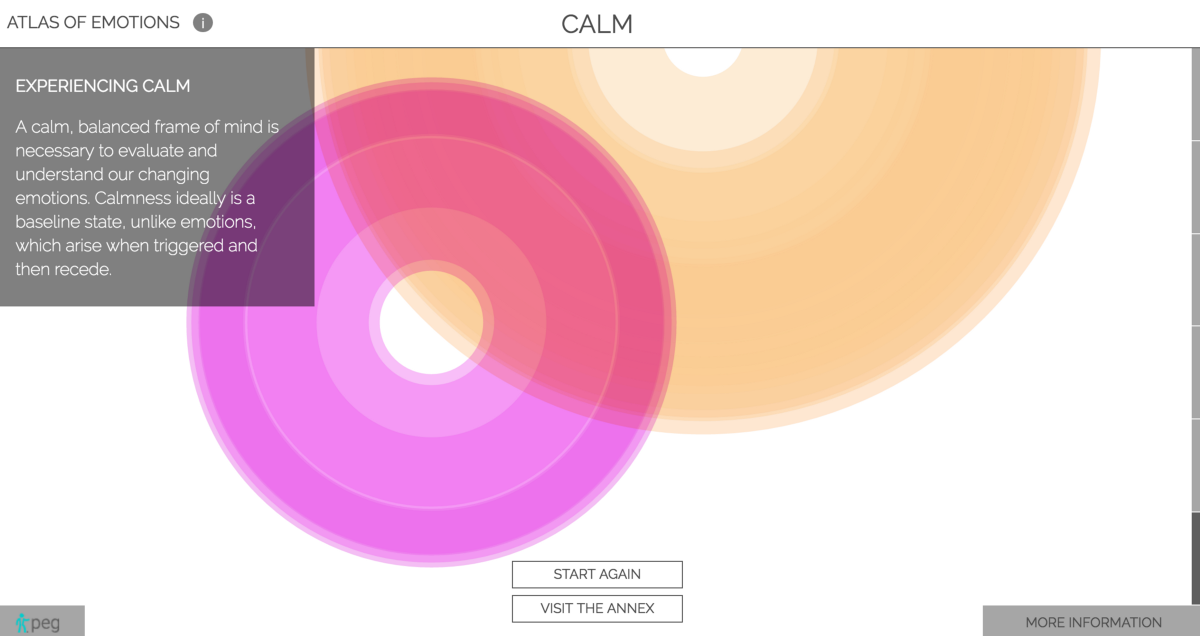
ZAN Yes, make a shape that looks disgusting. Then calm of course was another major challenge in this project. Lots of things, like how do you make stuff feel good and look good behind the scenes. We’ve talked about the ice skater analogy where if you do it well, you can’t see the hard work. Like assessing the overall placement so that things wouldn’t be overlapping at different aspect ratios.
ERIC Those things make the difference between a really nice piece and just a piece of software that you’re whanging data into. That’s important. That was a fun one. I liked that one a lot and I think a lot of decisions that got made way at the end of that project, just before launching, really made a big difference. It was fun.
ZAN There were two big challenges. One was when I was getting disgust to work, and the shape for how that was going to play out. The other was taking the challenge and running with it, but also knowing that the time is a constraint. How can I get this right fast? Faster in speed from a design perspective, or creative perspective, and also fast enough that we can keep doing it.
ERIC I think that’s one of the challenges of people who come to this work for the first time. There’s client who’s paying for it. You’re not in some tech company that has infinite money. There’s a specific budget and a specific amount of time, and we have to find that sweet spot between something that’s really good, but also something that we can get done with the resources we have.
ZAN It was amazing sitting with Eric & Nicolette. I think calm was literally the second to last day on the project. We weren’t satisfied with it yet and I had made some changes, but still had the small continents that were fading in and fading out based on the original view. They felt very isolated when they were small. I think it was literally 10 or 20 minutes of let’s try this, let’s try this, and Eric was like, “What if we make them huge?” Tweaking the timing and stuff. That captured how great it is to have collaborators that come with different experiences, and be able to just bounce ideas of each other and just to sit and actually — the code was there, and we had it set up really nicely that we could just tweak parameters, and see how things changed.
ERIC I think that’s one of the more fun parts of projects for me too is when I come in, even at the end, and say, “What if we made it five times as big?” Any of those kind of small changes, like turn it to 15 and see what comes out.
ZAN And good code enables that. When you do have the parameters set up nicely that you have levers that you can pull.
ERIC Right, that’s cool. Anything else you want to say about the work you did here?
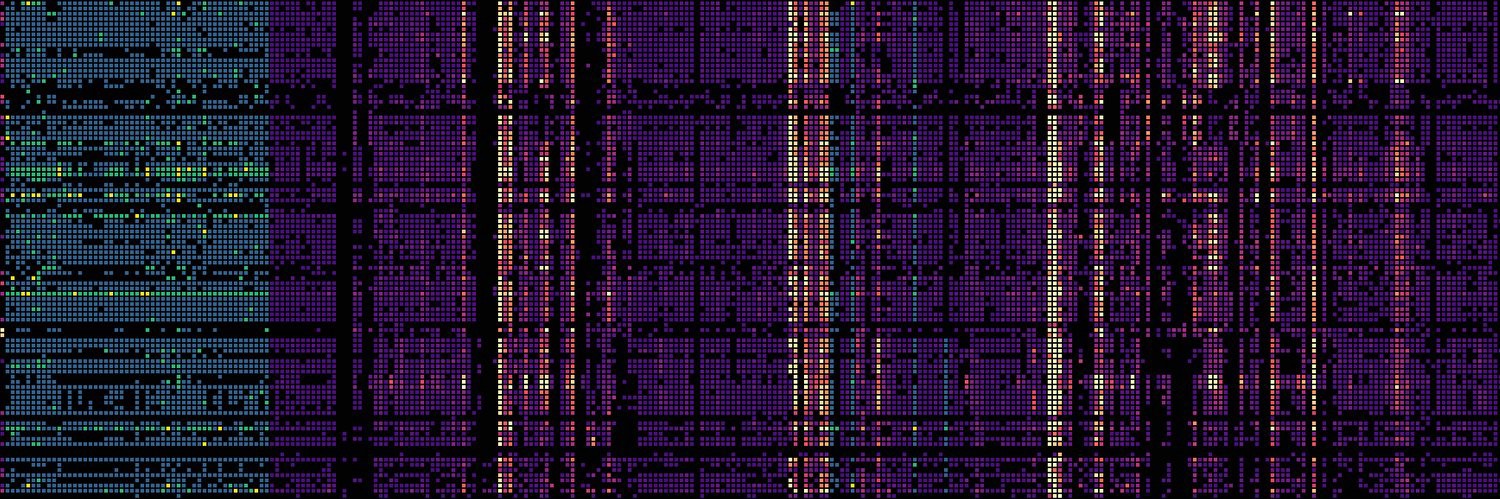
ZAN Working on metagenomics for the Banfield Group at UC Berkeley has been great. It’s a really interesting challenge of trying to understand the true needs of the scientists. Especially when there’s different scientists with different needs, and how to translate that into action. Especially in this project where it’s about the genomes of all of life! It’s got massive potential, and you could go in a million directions and try to figure out what to focus on.
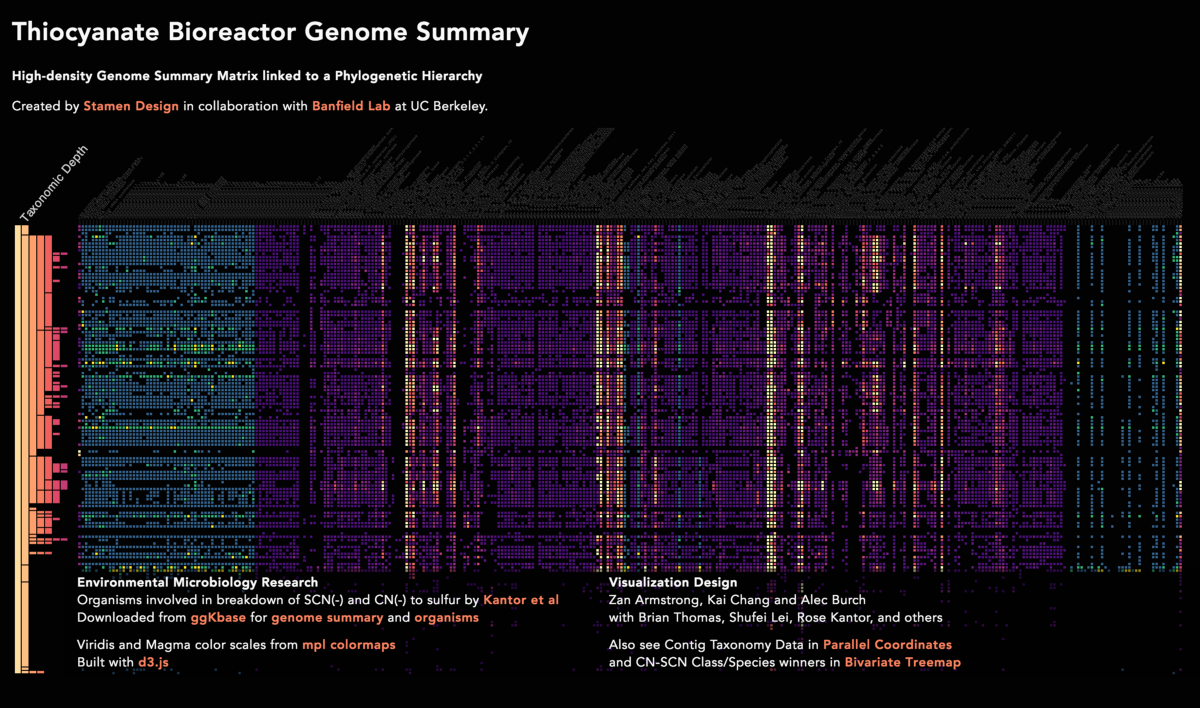
ERIC Right, and how did you get the focus on that one?
ZAN I think really listening to Brian at the Banfield Lab, listening to the scientists, trying to understand, translating some of the science. It really helped that I’d done some bioinformatics, so I had some grounding in that field. Really trying to just repeatedly ask and get at what the most important things about the data were. It’s interesting, because this was a situation where the numbers weren’t the most important thing. It was more about absence versus presence of a gene was really important. Even more the than exact value and I think that’s a really important thing, is trying to understand not just your numbers, what they are, but try to understand what aspects of this number matter, and how do each of them in the visualization. Then it was amazing working with Kai in the speed of — this is my second project done on canvas and getting to see all the advantages of working in canvas through collaborating with Kai.
ERIC What are those advantages?
ZAN Fast. It’s so fast [chuckles]! If you do it well.
ERIC To develop? Or to —
ZAN It makes things much faster in the browser. So one of the things that we really did was open up — they’d been doing a lot more smaller comparisons with a smaller number of organizers. I remember one of the scientists saying I just want to see everything. I just want to see all the genes in sample, I want to see all the list or many list.
ERIC There’s thousands of genes right?
ZAN Yeah and so now it’s all limited by the number of pixels rather than speed, which is amazing.
ERIC I remember seeing them before they were a bit clunky in the browser and it was hard to —
ZAN Yeah and that’s also Greg Corradini. Greg also worked on the back end in terms of speed. There were three or four major speed ups in that project as well which really opens things up. From being an analyst I know that when your system is slow you have to decide: is it worth asking this question or not? And the faster it is, the more questions you get to ask and the more questions you ask, the better the science you can do. So I think that was a really important part of the project. And just small things like giving control to the user so that instead of having a set size for every rectangle on the screen or every square, to get control. Because sometimes you want to have a bird’s eye view and you want to see lots and lots of stuff very small and other times when you want to zoom in and view parts of the project or the science. So instead of trying to figure out what the perfect thing is, you give that control over to the user and everything gets more powerful very quickly.
ERIC The tough one with that much information you have to make an interactive system that lets people look at it — we don’t want to make the one visualization that kind of rules them all, and making all of the decisions for the scientists. I guess the fine line for me there is you don’t want to just defer good design into a toggle. If it’s something they genuinely need a choice in, let them make it, but don’t just punt hard decisions off to AB testing or anything like that.
ZAN And that’s one with the cell size, I tried to kind of come up with an algorithm that would do it automatically, and we do have one in there that gives you a nice preset. But I realize, even for the exact same view, if you’re asking a different question you might want to see a different cell size. So it’s also good to know when to admit there is not a single answer for this question — or single good answer.
ERIC Right. And I think that’s what I’m hearing from scientists is that, especially around things like climate change, you need to communicate very precisely about uncertainty. It’s not just about feeding in the numbers and you get the answer out the other side, but that there’s a range. It’s not that they have no idea what’s going to happen and are just guessing, it’s that they know that the answer is within this very specific range. And there’re different ways to communicate visually about but they’re not super well-developed or understood. That’s a really big challenge that I want to try to help solve. It’s this idea of, as you said, speeding up the displays and making it good enough so a scientist can ask lots and lots of kinds of questions that they couldn’t ask before. I’m really looking forward to doing more of that.
Any advice for people who might be wanting to get into this work? What they should do, how they should go about it?
ZAN So Ian Johnson, who’s also done some work with Stamen, wrote a great medium article, interviewing a few people in the D3 community here about how they got into data viz. One of the major themes was to just try things, try things and do them. So in my case, I’m often driven by “I wanna do X, now I just figure how to do it.” So learning skills based on just deciding I’m gonna go for something and not feeling constrained by what you already know how to do in terms of what you create. A lot of times I see people that had a more artistic background play with “I know I can do X, now what can I do with that?” It’s kinda starting from the constraint based side of things.
But yeah, I think if you’re getting into it, I think I’d say start building stuff using blocks, asking questions. I think the most wonderful things about data visualization and Stamen is just that we’re part of a community where everybody’s learning, nobody knows everything, working in teams is fantastic, asking people for help is great. And there’s absolutely no way you can know it all [chuckles], so don’t feel bad that you don’t. And I really appreciate that on my first project here I was like, “I haven’t used leaflet before.” And you all said, “That’s fine. You’ll be fine, go for it.” And I was like, “Okay, I just wanted you to know. I know I can learn it. I just wanted to make sure you know [laughter].” But I really appreciated that and you just said, “Yes, of course. Just run with it.”
EE For me the answer is: just be curious. What I’ve tried to build into the DNA of the studio, and what I think is so great about data visualization now, is that curiosity is one of the most important things, and just saying, “What if?” is really a vital part of the work. One of my favorite aspects of Stamen is that there’re so many different projects. On each project you’re solving for a different problem, and you can’t just apply the same solution without understanding what’s the most interesting facet of this data, or what does the client need, and what does the audience need, and turn things. Sometimes that involves pulling from one technology to a different technology, sharing code, sharing ideas, all of that. It’s fun seeing the parallels between the code side and the design side. In both cases, there’s a lot of parallels in kind of how you think about the problems of pulling from different backgrounds and things like that.
ERIC I’ve gotten to that place where I realize that if people are interested in working on lots of different kinds of things, they should work here, and if not, then they shouldn’t [laughter]. That’s the flip side of it, too.
ZAN One of the things I was really craving — I came from Google, which has phenomenal data, it was super interesting from a data perspective — but it was also I was asking a lot of the same questions over and over again. It’s been fun. One of the things about here is asking about totally different questions and thinking about data in completely different ways, with completely different data sets. That was one of the things I was looking for, was having completely different types of data to think about.
ERIC Right. Yeah, it’s fun. It jogs my brain to be thinking about those kinds of things at the same time, too, and it just keeps me from getting bored.
ZAN Yeah [laughter].
ERIC So. What are you going to do next?
ZAN I just got married, so I’m going to use it as an excuse to go on a five-month honeymoon. I’m not sure what happens next. We’ll see.
ERIC Good! I just signed a nice long lease extension on our studio here in the Mission, so we’ll be here if and when you’re ready. Bon voyage!
ZAN Thank you! [chuckles]