Refactoring a dataviz website to create an extensible application
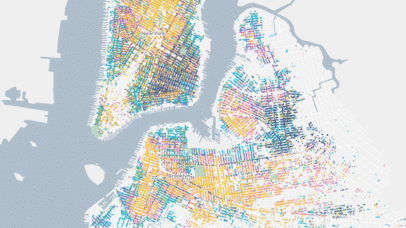
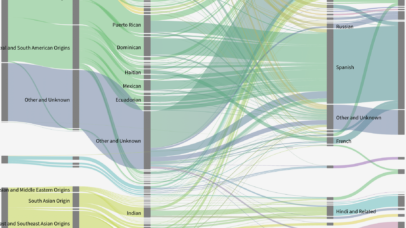
The Max Planck Institute hired Stamen a few years back to create a website to visualize increasingly complex urban transformations due to immigration for a project called Superdiversity. The site we created contains multiple interactive charts of census data to enable better research, analysis, and discussion of this novel phenomenon. Because diversity patterns in cities...