Big Glass Microphone at the V&A in London
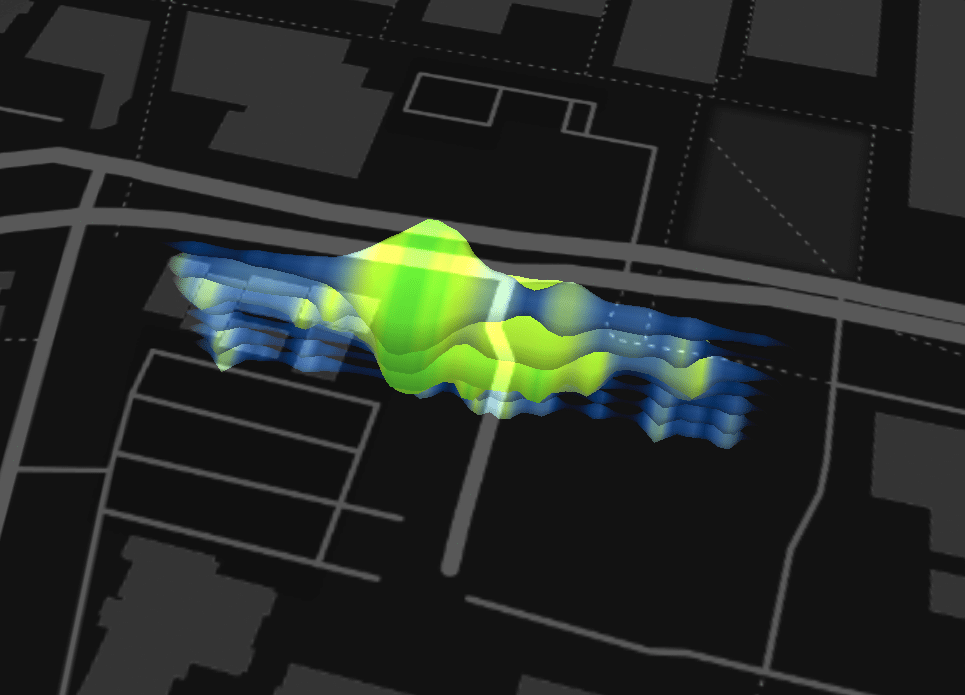
Visualizing vibrations in fiber optic cable buried under Stanford University, commissioned by the Victoria & Albert Museum
Background
Infrastructure is all around us. Some we can see, like roads, and some we can’t, like radio waves. Big Glass Microphone looks at the intersection between these two kinds of infrastructure by visualizing the vibrations in a five kilometer long fiber optic cable buried underneath the campus of Stanford University. The cable is mostly used for analyzing seismic waves as they pass through campus; we’re using it to look closer at activities closer to home. Fiber optic cables are usually used for sending signals from one place to another. The vibrations that nearby moving objects cause in the cables are usually considered undesirable and filtered out as noise. But by turning the noise into signal, we can make inferences about things that are near that cable.
What we made
Using Distributed Acoustic Sensing technology from Optasense, a company that installs this technology along railroads, pipelines, and other infrastructure, Big Glass Mic visualizes the distinct shapes that different kinds of events have on this fascinating incidental listening device. Each horizontal band represents a different frequency of vibration: 0–0.6hz, 10–20hz and so on, up to 320 Hertz. The voiced speech of a typical adult male will have a fundamental frequency from 85 to 180 Hz, and that of a typical adult female from 165 to 255 Hz. The lowermost horizontal bands are sounds we can hear, and the uppermost bands are subsonic vibrations. The brighter the section of band, the more intense the vibration at that scale.