Whoa.
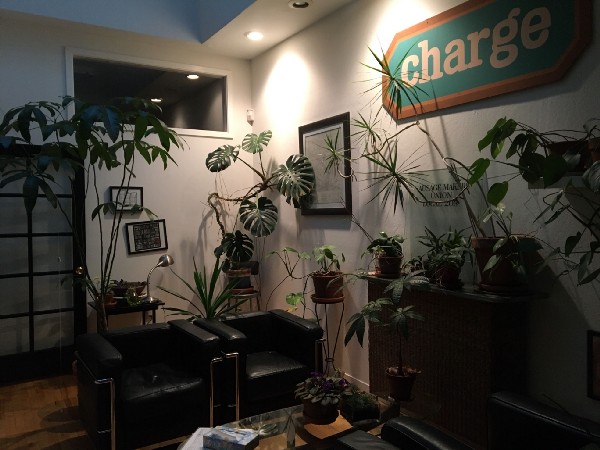
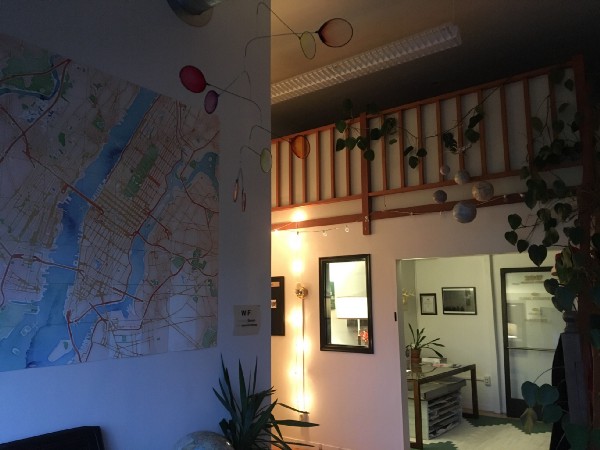
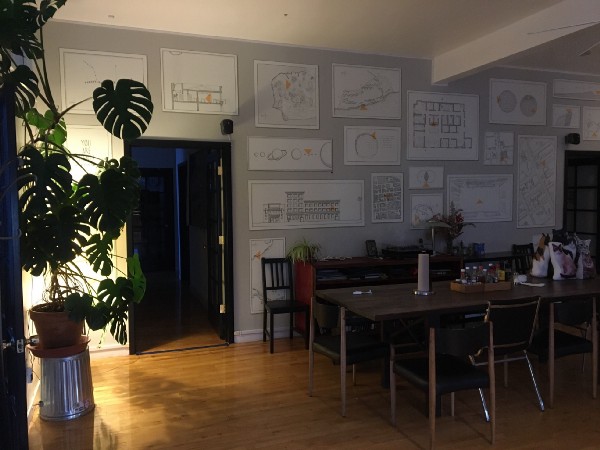
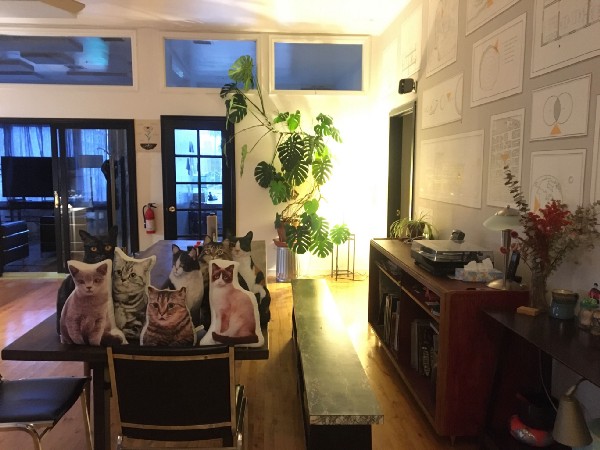
When the lockdowns happened back in March 2020, we all started realizing that we weren’t going to be gathering together at Stamen HQ any time soon, and things got, well, weird. I love working at Stamen, and I think I speak for the rest of my team when I say that we love working together in the same space, surrounded by books and music and flowers. We all started working from home, in a familiar story of zooms and hangouts and home office setups. As the lockdown took hold, our inbound leads and opportunities just…stalled, our beautiful studio was standing empty, and the phone was awfully quiet. And I started to really freak out.
The challenge we faced at the beginning of the lockdowns was: how can we be useful in this moment? Things were changing not over the course of years and months but over days and hours, people were (and are) literally dying because they’re not listening to public health officials (or their visuals), and our shop was not at all sure that we could continue to be a viable enterprise given all this new and uncertain landscape. It was an existentially terrifying moment, one that I wasn’t at all sure we could meet and survive, let alone thrive in. We wondered how we could be of some use, how we could turn our skills in the direction of helpfulness and usefulness, and had some hard conversations about how to operate in this crazy new moment of early 2020.
And then Migurski called!
Mike is a friend and was my first partner at Stamen. After his time at the shop he went on to work for a number of interesting groups like Code for America (did you know they started their first office working out of Stamen HQ?) and Planscore, and is now at Facebook’s Spatial Computing group (pro tip: stay friends with your former partners & employees; some of them might hire you, and might even ask you to be on their philanthropic boards). Here’s what he wrote to ask me on April 4, 2020:
Is Stamen available for a possible high-urgency COVID-19 project with Facebook?
The Data For Good side of the house here is working with Andrew Schroeder of DirectRelief the group behind https://www.covid19mobility.org. They would like to upgrade their data communication and display in response to a new social distancing dataset FB’s Core Data Science team is putting together.
We are looking at a few potential paths, from having FB engineers doing it to using something like Tableau to seeing whether Stamen has capacity for this kind of thing.
Were we available? Were we ever! We got in touch with Mike within 20 minutes, had a meeting with his team the next morning, and on April 20 (16 days later) we helped support the launch of our collaboration on Facebook’s Data for Good Mobility Dashboard.
The dashboard is a collaboration between Facebook Data for Good and the Covid-19 Mobility Data Network, a voluntary coalition of researchers and non-profits coordinated by Direct Relief and researchers from the Harvard TH Chan School of Public Health. It tracks changes in human mobility relative to pre-pandemic levels, and is (unfortunately) still being used around the world to track how much people are moving, or not, in this crazy time. After a couple of weeks the project, which started with coverage of states and counties in the United States, branched out to include Turkey (whose mobility is down an astonishing 49.2% since March), France (down 20%) Mexico, the UK, and other countries. It’s been a wild journey to say the least, watching how the world has shifted since March; who gets to stay home, and who chooses not to.
We’ve continued to work with the Data for Good team; Facebook has a national survey of people voluntarily reporting COVID-19 symptoms relative to things like people staying in place, and we worked with them to visualize this information over time on a similar map:
The shutdowns came as we were getting closer to launching some new work with the University of California in San Francisco; a Health Atlas that was originally intended to bring the concept of public immune health in California to a broader audience. After the pandemic hit, suddenly everyone knew about public health issues, which changed how we thought about and designed things. We made sure (with UCSF’s expert guidance) that, in addition to being able to visualize things like food insecurity in the Tenderloin, you can look at the relationship between COVID-19 and people over 65, COVID-19 in prisons, and many, many other variables.
The circumstances that made this work necessary are of course very difficult to deal with; but we’re very glad to have been asked to help using the skills that we have, and grateful to be among the lucky ones who can continue to operate given everything that’s going on.
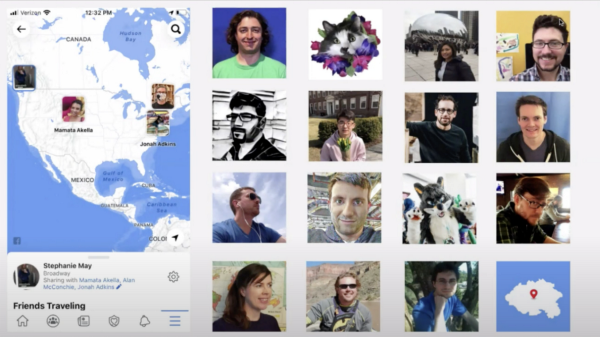
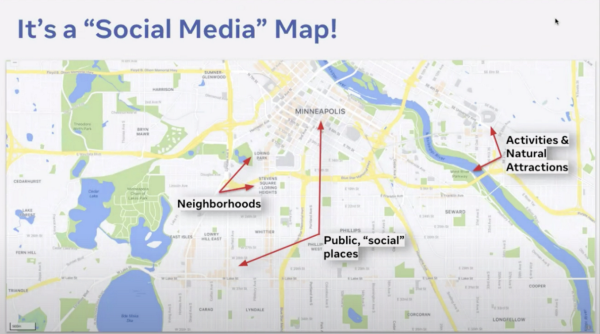
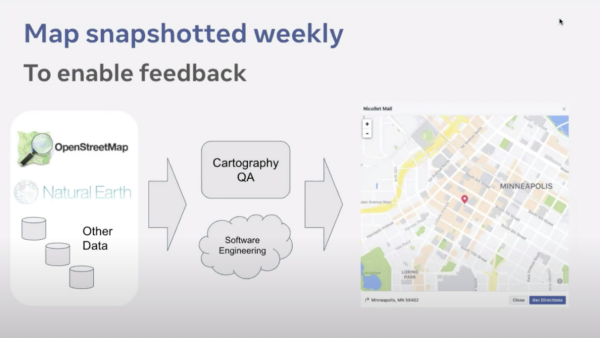
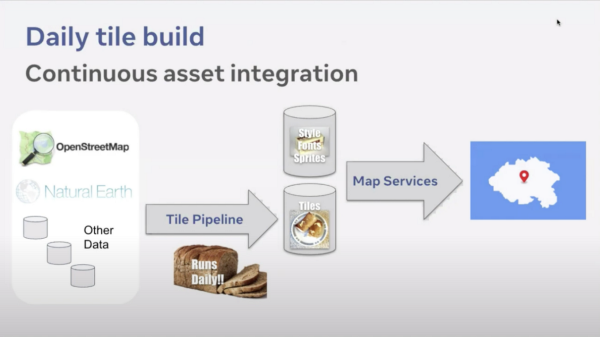
COVID-19 aside (to the degree that’s possible), we’ve been busy with our normal practice of mapping and data visualization projects. I’m excited to be able to announce that, working alongside Stephanie May and others, Stamen spent much of last year redesigning Facebook’s maps, and they’re live! Our own (I’m so excited to say “our own”) Jonah Adkins (check out his tweet about OSM & rainbows & Stamen!) and our Lead Cartographer Alan McConchie will have much more to say about this in an extensive project review, and Stephanie and Vladimir Gluzman Peregrine talked about the project during their presentation at the North American Cartographic Information Society’s annual conference, but this is the first time that I’m able to announce how proud I am of the work we’ve been doing with open data at Facebook. It was certainly a heavy lift and took a diverse and talented team to do it, a team we’re very glad to be a part of.
“[Working with Stamen] gave us the flexibility to not just be one cartographic voice shouting in the wind, but to be a bunch of cartographers embedded with a bunch of engineers, learning from each other in an integrated team.” — Stephanie May
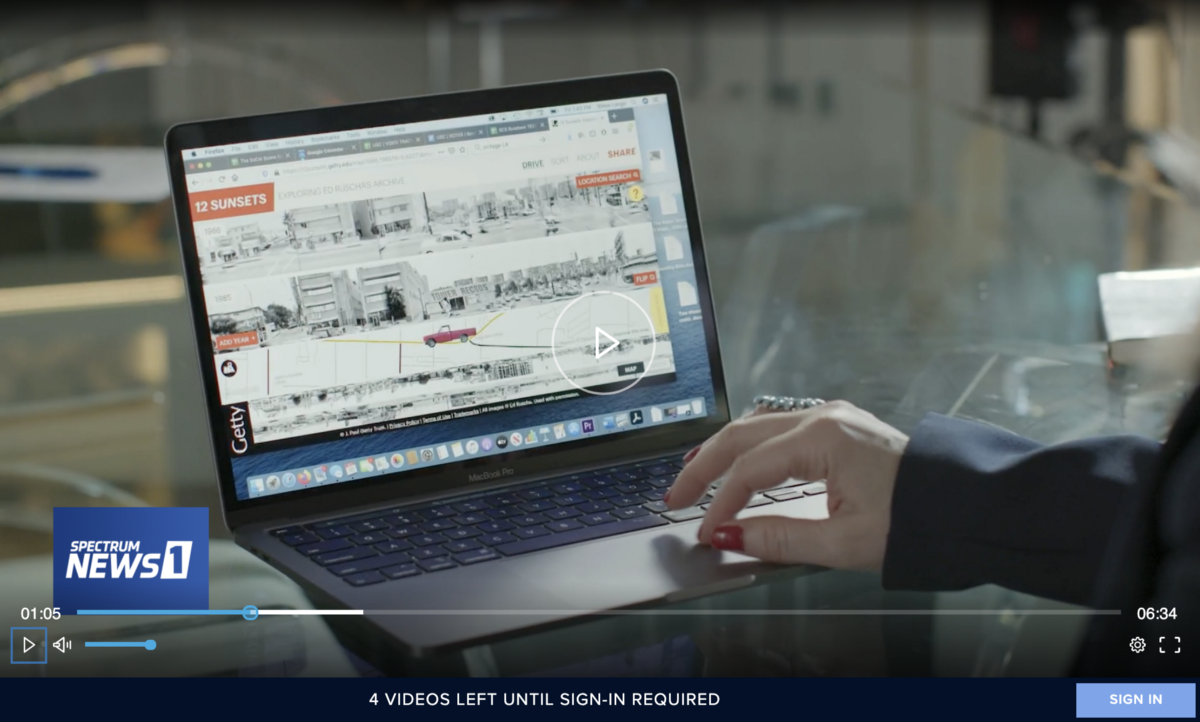
The client project that I was most closely involved with this year was a chance to stand on the shoulders of giants. It started with Ed Ruscha and his team taking hundreds of thousands of automatic photographs from the bed of a truck driving down Sunset Boulevard in Los Angeles, every couple of years for fifty years. The middle part was where the Getty Research Institute acquired all those photographs and painstakingly scanned them, geotagging them in the process and applying optical character recognition techniques to analyze all the words in them and machine vision algorithms to determine what was in them. The last bit was where we were delighted to come in. We were tasked with dreaming up and building a data visualization project that would be engaging and fun and introduce the public to this astounding archive in ways that would get people excited about the archive, Ed, the Getty and the project. It’s called 12 Sunsets and it’s live, yo, at http://12sunsets.getty.edu.
Museums can sometimes struggle to put their collections online in a way that meets the internet where it is; a fast-moving quickly-changing network of millions of individual voices. I think this is largely because their institutional remits typically tend to require them to take a long view of conservation & preservation of their collections. It was incredibly refreshing to learn that the Getty’s timeline for our part of the project was only intended to last for three years or so (though I hope it will be up much longer); it freed us all from having to deal with the sometimes slow (though important) work of thinking in a very long term way about things and focus on making something fun. The Getty team was incredibly supportive of the work all the way through and we’re hoping we can go back into their amazing archives in person again some time.
One of the measures of the project’s success was how it would be received in the press. I was perhaps most gratified that the project caught the attention of Jason Kottke, whose blog I’ve been reading since about 1998 and whom I have a huge amount of respect for. For Jason to write “This is so much fun to play with!” was incredibly gratifying. But to read this by Jason Smee in the Washington Post just took things to a whole new level:
A website implies a desire for utility, but the deeper purposes of “12 Sunsets” may never become clear. We know already that “Every Building on the Sunset Strip” helped inspire one of the most influential architectural texts of the 20th century: “Learning from Las Vegas,” by Denise Scott Brown, Robert Venturi and Steven Izenour. That 1972 book, which celebrated advertising and apparently arbitrary decoration as legitimately expressive parts of architecture, thereby leading the way into postmodernism, grew, in part, out of a seminar held in Ruscha’s studio.
Going forward, it’s easy to see “12 Sunsets” inspiring a new generation of West Coast artists or minimalist composers. I could see it being used as the conceptual motor powering a novel by Don DeLillo, or featuring in an intricate plot by some latter-day Elmore Leonard. Of course, it could also be enthusiastically taken up at the annual meeting of the National Society of Professional Surveyors or find itself the subject of a poorly attended afternoon session on the final day of a crushingly dull real estate conference. Anything is possible.
Wow!
We continue to work with the scientists at MPG Ranch on their amazing stewardship and restoration of thousands of acres in Western Montana, building them tools to help them better understand and communicate about the work that this 30-odd scientist team is doing across the seasons. Our previous work with this group was primarily concerned with the movement of wildlife and the restoration of different parcels around the Ranch; this year we graduated to visualizing the interrelationships between different species on the Ranch to predict the second-order impacts of conservation efforts; it’s called MPG Matrix. I find it fascinating to play with; you can see how (say) the reduction in the number of hunters interplays with the amount of rain to increase and decrease the number of elk and the amount of weed grass, and how the implications of those choices ripple between ecological strata.
I’ve often said that Dune by Frank Herbert is the closest book I have to a religious text, and Herbert’s writings on ecology in the book are among the things that make me pick it up about once a year for a refresher (did you know that magic mushrooms inspired Dune? also, the CEO of GT Kombucha, the biggest kombucha brewer in the world, was interviewed on Inc Magazine saying he takes ayahuasca every year to refresh his mind & be a better CEO. but I digress). Playing with the Matrix puts me back in that mindset of wonder at the interrelationships that characterize complex ecosystems. I just love it.
We also worked on a number of projects that I’m not able to talk about (yet), which is unusual for Stamen. It’s so much easier and more effective to show someone you can do a thing, instead of having to tell them that you can do a thing. If I know anything it’s that you get the kind of work you’ve already done, which is one reason why it’s so important to me to be able to talk about our projects in public, and so it’s been challenging to take on projects that we’re not able to talk about. The real upside is that part of how we’ve been able to grow is taking on some of those projects, and grow we have! Check out this map by the amazing Catalina Plé showing the locations of everyone who worked at Stamen in 2020:
We quietly rebranded our website as well, which was a long time coming. It’s all drag and drop now, so now we’ve got a place to keep some of the lovely press we’ve been getting in the Washington Post, Fast Company and (perhaps best of all) kottke.org!
Finally, we were lucky enough to talk with some amazing people in public about the work we do and how it sits in the world. Jessica Helfand at Design Observer interviewed Nicolette and I, which was just a delight. I’ve been looking to DesignObserver since I was first working on the Internet at Quokka Sports in the late 90s, and talking with Jessica was like being interviewed by one of my heroes, which she is.
Amira and I did an interview with Allison Martino of SoCal Scene, about the Getty & Ed Ruscha’s 12 Sunsets project, which served as a kind of dual intro to the project and explanation of the interface, which was just terrific:
And we were invited to talk about where cities are and what comes after COVID-19 with the California College of the Arts:
There were a number of others; you can read more about the ways we were out in public on our new press page.
As we close, I’ll just take a moment to state some basic principles that have coalesced for me after twenty years of doing data visualization projects for clients. Try as I might, I’ve never managed to get one of these end of year blog posts out before January (and that’s before we had an insurrection and all kinds of other distracting nonsense). I’ve felt not…guilty per se, but a bit annoyed that perhaps as I’m not as proactive and organized about blogging as I could be. The pandemic has given me the great gift of time to rethink this and so many other aspects of our work.
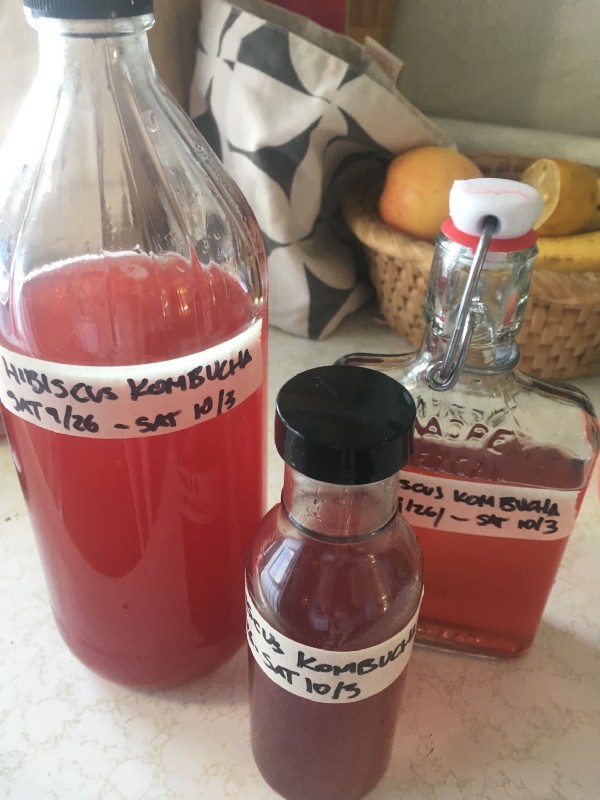
Work takes time. It takes time to reflect and consider. Ferments take time. Gardens take time. Work, ferments and gardens all involve trying things and making mistakes. Mistakes are an important part of progress. If this last year (and what a f*cking year it has been) has taught me anything it’s that it’s making highly detailed plans and expecting to stick to them is a fool’s errand. We’re all doing the best we can with what we’ve got. Hope in the dark is a tactic and a strategy, not a set of wishful thinkings. Effectiveness is more important than efficiency. A cherry tree isn’t particularly efficient, but it sure is effective! I strive to find ways to measure and value thoughtfulness, intention and quality right alongside profitability, number of clicks and page views, and efficiency. It’s not always easy, but hey: we’re not running a shoe store here. There’s got to be more to this than the bottom line. Otherwise why bother?
In a weird way this is putting me in mind of the first Stamen project I did with Mike in 2003, the first one that made me stretch beyond my own capabilities as a front-end designer and start to think about developing real software projects with backends and servers and all of that. DesignWorks USA was looking for a way to help the car designers at BMW communicate about their work in ways that could hold their own with the more numbers-driven approaches that engineering and finance would come to the table with. Dane Howard, who I’d worked with at Quokka, recommended me for the work (I’ll follow up with another post about how to start your own design company in a bit; lmk if that would be of interest.) I signed on for the project, not knowing how I would get it done, since I had no idea how to build a backend system that could meet their needs. But that was just the beginning. Rule number 1 is get the work; figuring out how to do it and do it well is super important, but that comes later.
If you wanna be a doctor, look before you leap. If you wanna be in show business, leap before you look. — Steven Spielberg
I asked around and eventually found Mike Migurski (who hired us for Facebook, see above), who was willing to work with me on nights and weekends (he had a day job and was in his early 20s and didn’t mind staying up all night and banging on keyboards with me) on the project. The two of us built BMW a system that would help automotive designers frame their ideas and proposals in a format that would land well in meetings with budget-minded business executives.
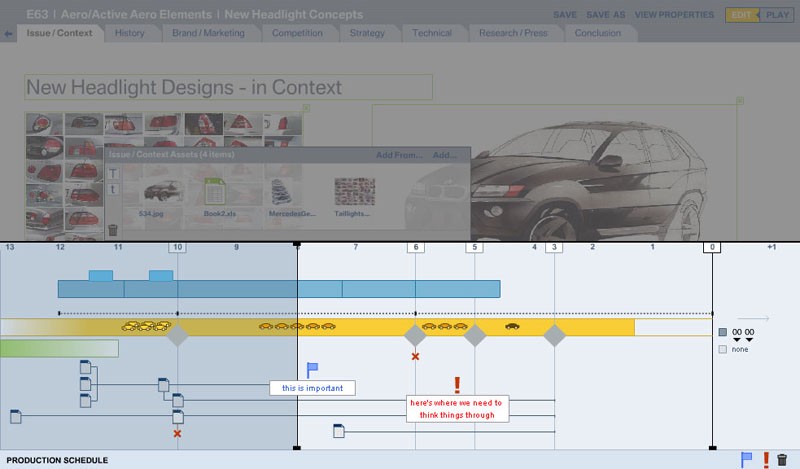
I think you could say that’s what I’ve been doing at Stamen since the beginning; finding ways to help people take the unquantifiable nature of the work that’s mission critical for them and turning it into software that helps them bring that value forward. It’s a common thread across car companies, scientific institutions, social media companies, NGOs, nonprofits, media companies, artists, financial institutions, architects, city planners, universities political action committees…we’ve found a good thread to pull on. It connects to every other thread in the sweater.
As always, the variety of the projects we do is the thing I take the most pride in here at Stamen. We’ve come through a challenging and difficult year with a renewed sense of purpose and commitment to the work, and I’m beyond grateful to our team and our clients for their contributions to our success in this extraordinary time.
If you find yourself wanting to take your data communications efforts to the next level, please do get in touch!
And Happy 2021.
