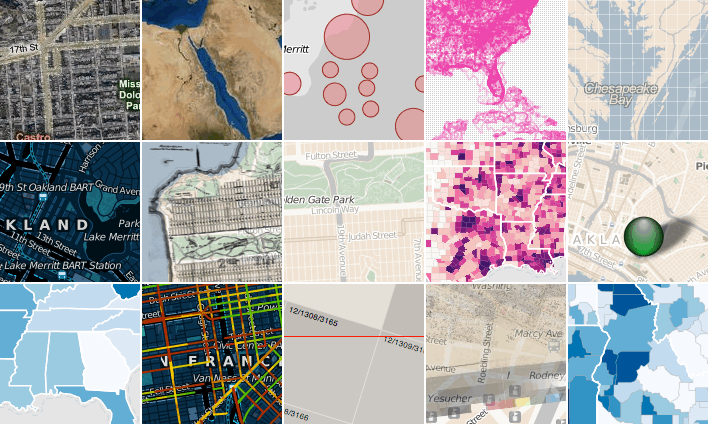
I posted some early examples last week, and SimpleGeo announced this morning the result of our collaboration with them over the past few months: Polymaps.org.

We’ve been working with Stamen to provide visual analysis of the huge datasets that we’re working with, and how people can communicate this data in sophisticated ways. A first step toward that goal is the release of a free and open-source set of tools and map engines allowing people to perform relatively sophisticated operations on their data in the browser. The project has been online for a while at http://github.com/simplegeo/polymaps, and you can download the source code there; what’s new is the addition of a series of example maps so you can demonstrate what’s going on, and human-readable documentation so you can use them for your own projects. Some of the examples are straightforward, letting you do things like group points into clusters and drop scaled gradients on to map locations. Others are more robust, letting you do things like change which direction is north by rotating the map and visualize the quality of street surfaces in San Francisco.
We’ve been lucky enough to work with Mike Bostock on these this summer, and he’s really outdone himself. If I had doubts about the ability of non-flash browser-native tech like Canvas and SVG to do expressive and richly interactive mapping (and I did), consider me a convert.
Now about that easter egg…

