
Few things are more vital to a city than safe, accessible fresh water. More than 20% of the world’s population lives in areas where access to clean, fresh water is challenging. It’s obvious: Healthy cities need reliable clean water to thrive.
But how do we achieve that critical goal of safe, secure water supplies for hundreds of cities all over the world?
The Nature Conservancy, working with the C40 Cities Climate Leadership Group and the International Water Association, has the answer: Conservation strategies could benefit more than 700 million people in the world’s 100 largest cities — one out of 10 people on the planet.
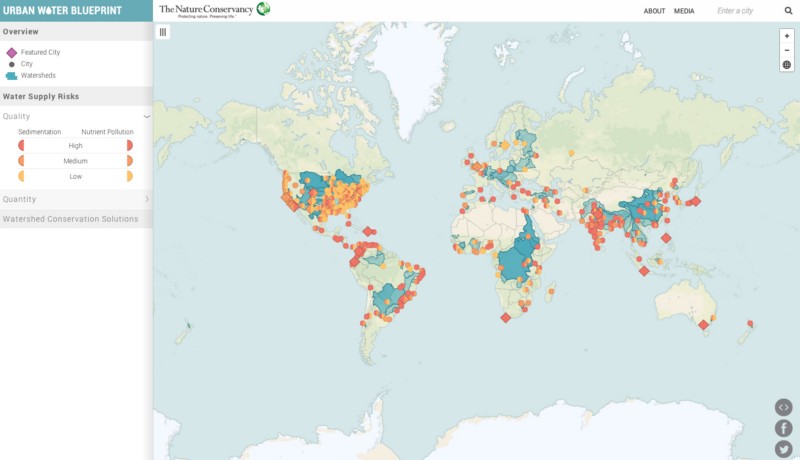
A rich, new dataset created by Nature Conservancy scientists — and visualized by us — illustrates this opportunity, for more than 500 cities worldwide. In many cases, solutions are very manageable, making cities’ water systems safer and more secure while also benefitting wildlife and ecosystems. The dataset breaks down the water data metrics by quality:
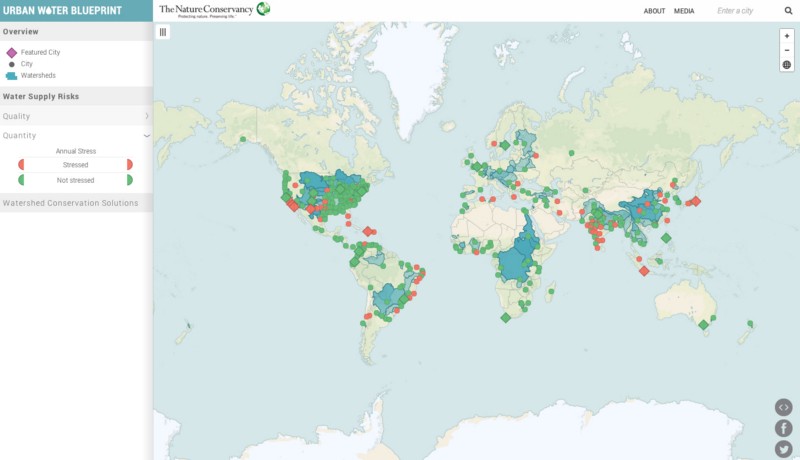
..and by quantity:
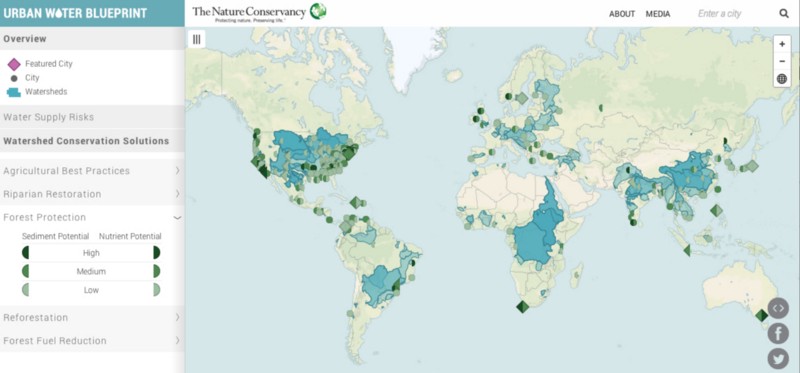
It also covers the nature-based solutions cities could use to make their water systems safer and more secure, including best practices for agriculture, riparian restoration, forest protection, reforestation, and forest fuel reduction. These actions help to conserve water while benefitting wildlife and ecosystems in the process.
TNC brings incredible depth of knowledge to the work, and asked Stamen to help find a way to make their data approachable, engaging and navigable for city managers, mayors, water managers, and residents in cities around the world. The data itself covers 25 different variables for 535 cities, and those cities contain 1,840 “diversions” — watersheds, desalination plants, groundwater withdrawal points — and each of those has nine or 10 data points. If you’re following along at home, that’s 13,375 city data points and 18,000 watershed data points. It’s a lot for experts to manage, not to mention civilians!
The goal, of course, wasn’t to drown people in all that data, but rather to reveal the most interesting and relevant information at the right time. The team at the Nature Conservancy selected 25 cities to highlight with narratives and images that highlight the story they wanted to tell — that conservation works for people and nature — and our map and page designs showcase that message.
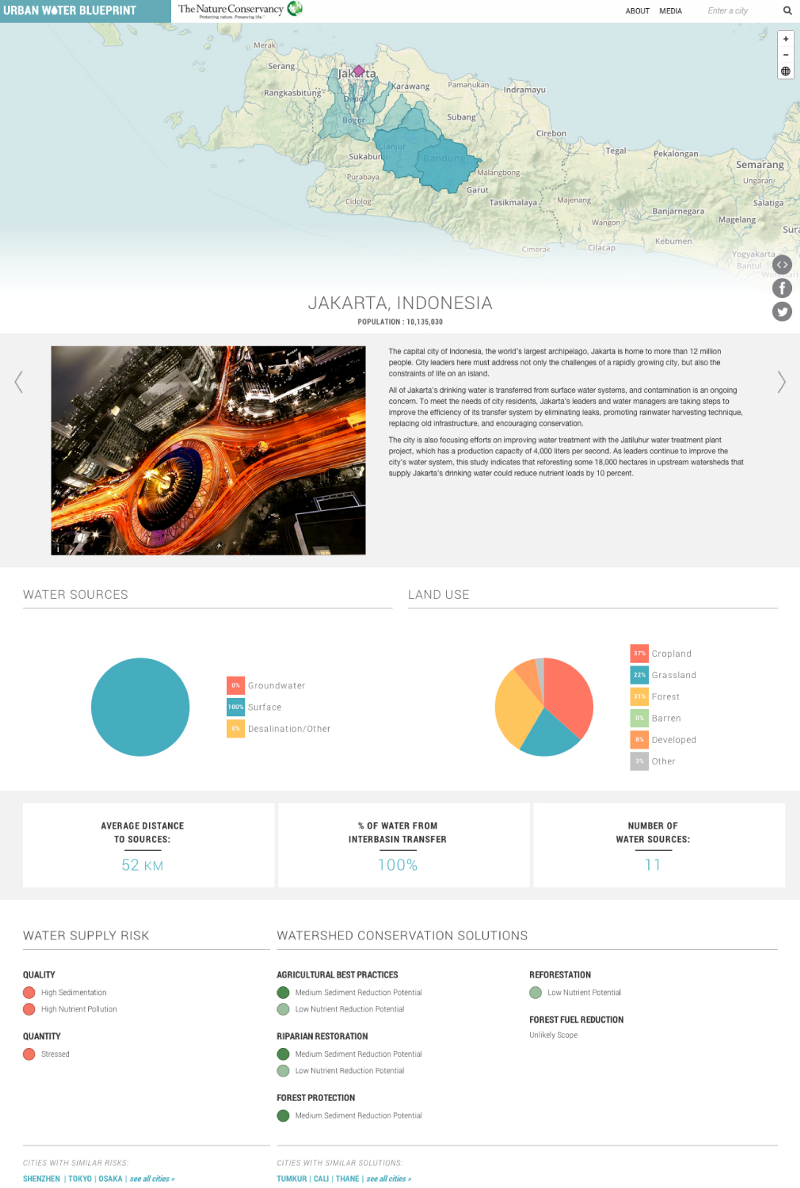
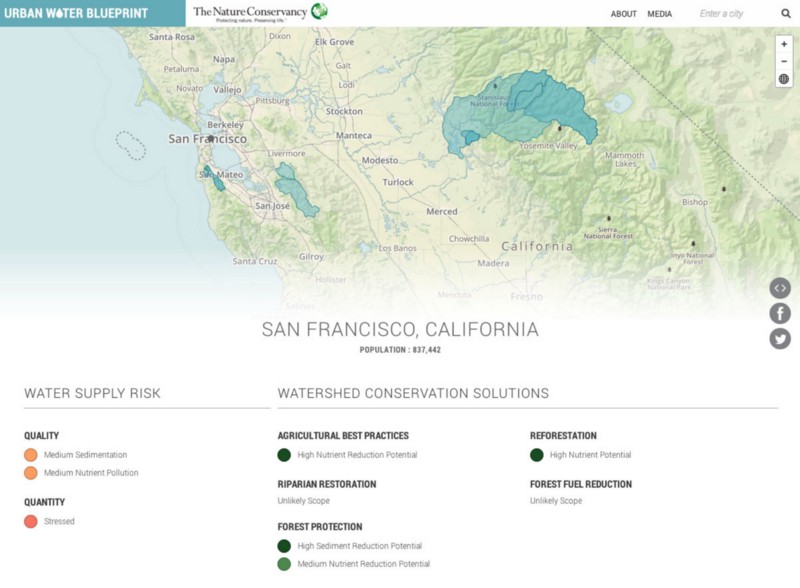
Once you find yourself on a city page, in Jakarta, for example, you can take in the whole sweep of that city’s water situation with a few simple charts and color-coded ratings. At a glance, you see that much of Jakarta’s water comes from afar, and that its overall water supply is very stressed.
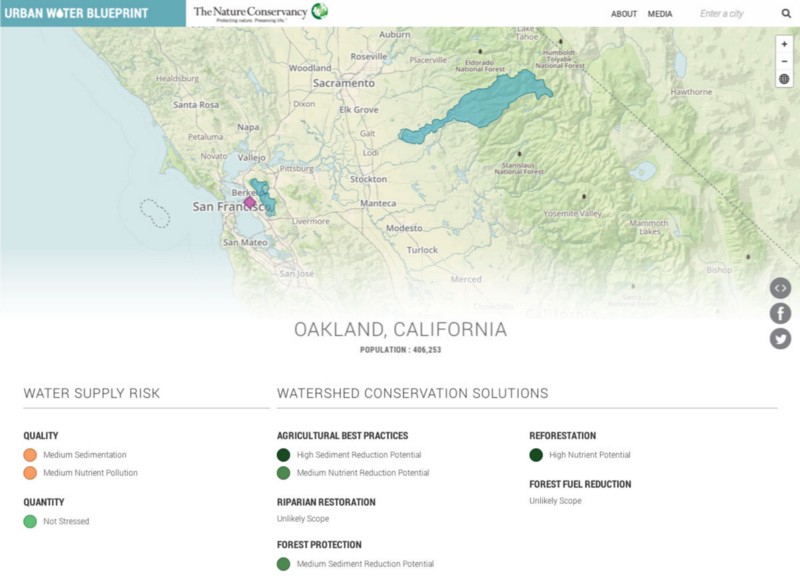
You might also easily see how neighboring cities — like Oakland and San Francisco, sometimes have very different water supplies and, consequenly, water challenges. In particular, San Francisco’s water quantity is stressed while Oakland’s is not.
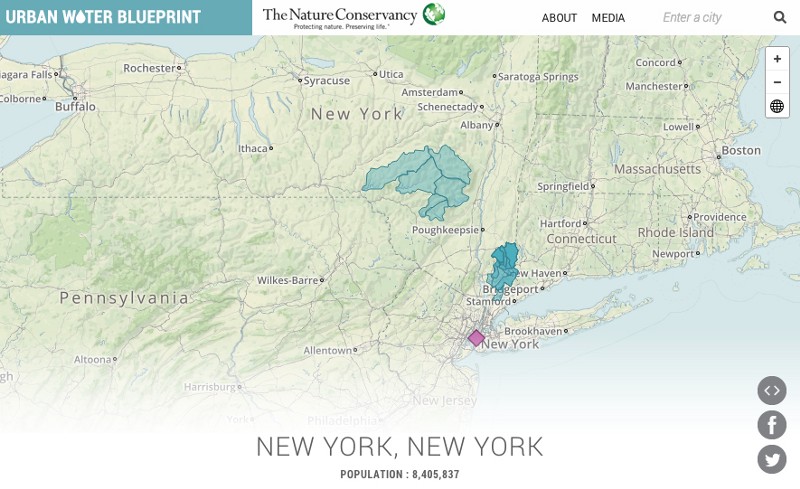
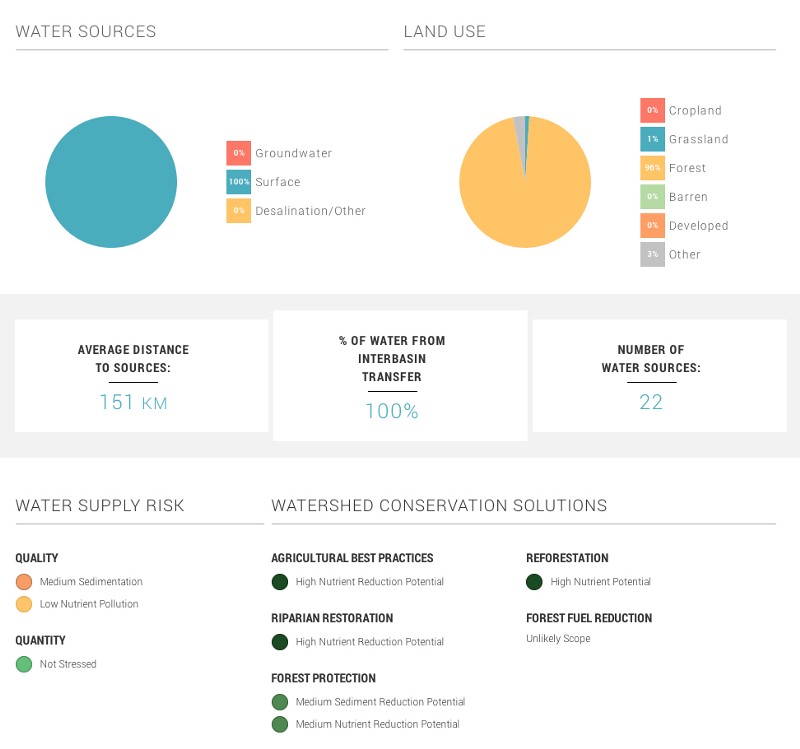
In the end, protecting an upstream watershed from deforestation can improve water quality as much or more than installing an expensive treatment plant. This has significant impact on the bottom line, and New York City’s story is a perfect illustration. In the 90’s the city was tasked to meet state and federal regulations to comply with the federal Safe Drinking Water Act. One option on the table was to create a water treatment plan to the tune of $8–10 billion, not including annual operating and maintenance costs. The option they went with instead was protecting the city’s forested watershed, which cost $1.5 billion and has yielded some of the best drinking water in the world.
San Diego’s approach is a different one: paying farmers to implement conservation measures so the water they save can then be used in the city.
All in all, TNC estimates that the water utilities surveyed could save nearly a billion dollars a year by investing in watershed conservation. For more on the economic impact of water conservation, download the full report at the bottom of the opening page.
This map is the culmination of years of work by TNC scientists. We are honored and delighted to have been able to work with them to represent their important work in a clear and accurate way. The Urban Water Blueprint is also designed to explore and share, so that people around the world can understand and talk about the water challenges faced by their cities. Most importantly, like TNC, we hope to see city leaders take action to protect water for people and nature.
Less doom and gloom, fewer dollars spent! There’s no reason not to conserve.