A collection of all blog posts by Eric Brelsford.

blog/Eric Brelsford

Telling the Story of Changing Populations With Mapping Historical New York: A Digital Atlas

Eric Brelsford | 10.24.24

Content in this post comes from our presentation at the North American Cartographic Information Society (NACIS) 2024 Annual Meeting last week in Tacoma, WA. Mapping Historical New York: A Digital Atlas visualizes New York City’s transformations during the late-nineteenth and early-twentieth centuries both in terms of population and landscape. Drawing on 1850, 1880, 1910, and...

Manzanar UpClose In-Depth

Eric Brelsford | 02.08.24

As we mentioned recently, Stamen worked with Densho in 2023 to create Manzanar CloseUp, a map of the Manzanar concentration camp in California where Japanese Americans were incarcerated during WWII. Where our previous work on Sites of Shame visualizes all of the camps that existed and the aggregated movement of individuals to and from camps,...

Down In the Sewers Tracking Viruses with WastewaterSCAN

Eric Brelsford | 02.16.23

Late last year, Stamen worked with the group WastewaterSCAN to build a new home for the group’s public-facing charts that visualize the data they collect from wastewater treatment plants across the US. If you’ve been keeping an eye on the latest data regarding COVID-19 and other viruses like RSV, you might have noticed that there...

Mapping the Changing Coast with the Southern Environmental Law Center

Eric Brelsford | 02.07.23

In 2022 we had the pleasure of sitting down with Jovian Sackett from the Southern Environmental Law Center to talk about our collaboration on The Changing Coast and the work Jovian does more broadly. The conversation ranged from the decisions that went into making The Changing Coast map, communicating with data, and the data questions...

Mapping Historical New York with dot density maps

Eric Brelsford | 03.03.22

In 2021 Stamen had the pleasure of working on Mapping Historical New York with Columbia University’s Center for Spatial Research. The Center came to the table with a large and unique dataset of historical census data for the areas that are now Manhattan and Brooklyn dating back to 1850. Part of what is special about...

Introducing Scale-a-Tron

Eric Brelsford | 04.22.21

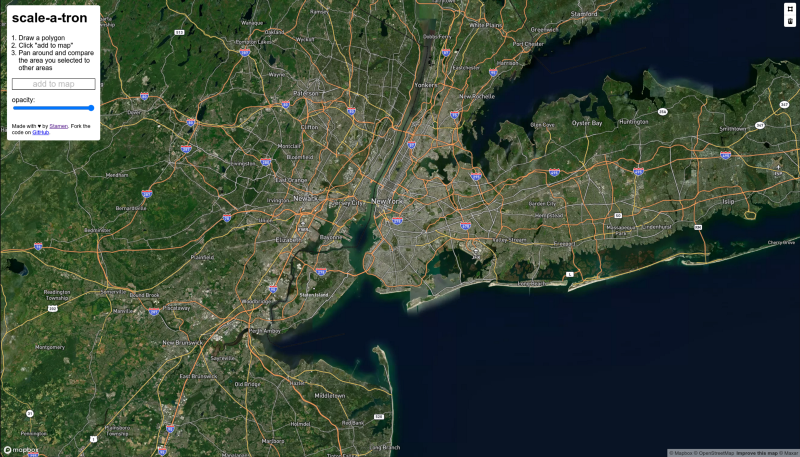
By Eric Brelsford and Alan McConchie It’s hard to believe that it was only one a month ago when the Ever Given container ship got stuck in the Suez Canal. As cartographers, one of our favorite memes from the Ever Given era was the Ever Given Ever Ywhere tool built by Garrett Dash Nelson, that...

Introducing the Ground Control Point interface

Eric Brelsford | 06.28.18

Sure, your drone can take videos and photos from above, but while you’re taking those photos why not turn them into something mappy? OpenDroneMap is an open source toolkit that can help you do that. It takes aerial imagery such as that created with your drone and turns it into several other types of data,...