
In 2022 we had the pleasure of sitting down with Jovian Sackett from the Southern Environmental Law Center to talk about our collaboration on The Changing Coast and the work Jovian does more broadly. The conversation ranged from the decisions that went into making The Changing Coast map, communicating with data, and the data questions that keep Jovian up at night. Below you can listen to the audio of the conversation or read the transcript (lightly edited for clarity).
EB: Hi, I’m Eric Brelsford. I’m Lead Design Technologist here at Stamen Design. Today, we’re talking with Jovian Sackett from SELC, Southern Environmental Law Center, about a project that we worked on with SELC in 2021. Jovian, would you mind introducing yourself?
JS: Sure. So my name is Jovian Sackett. I am the Director of Geospatial Science for the Southern Environmental Law Center. And yeah, as Eric mentioned, we worked with Stamen to help sort of translate an internal clunky tool into something that would have a better public-facing engagement and focused on coastal resilience and solutions around that in the south.
EB: Thanks for that. And before we get going, would you mind talking through your background in GIS a little bit?
JS: Sure. So I came to GIS as an undergrad. If I’m doing the math now, I guess I’m officially at the 20-year mark–it was my sophomore year. So that was 2002. As an environmental studies major, we were encouraged to take GIS as a skill you need to be learning. At the time, I was just thinking–I didn’t quite know what it was, but it caught on fast. And I saw the value in sort of being able to sort of look at data spatially and use it for environmental problem-solving. So I guess I gravitated towards it right away. I wasn’t focused on while I want to work in GIS because, at the time, it seemed like a lot of GIS jobs were sort of more local government-focused. And I was more interested in sort of environmental conservation and protection work and sort of the nonprofit sector and sort of bringing GIS into environmental problem-solving in a way that I wasn’t really seeing it done at the time. That’s very focused looking backwards, but at the time, it was not so clear.
EB: So you were coming at this already coming from an environmental policy point of view, and you took GIS while in college for that?
JS: Correct. Yeah. So my undergraduate degree, I started in environmental studies and ended up dual majoring in geography once I found out I was spending all my time with geography as well but also covered things like environmental law, environmental politics, natural resources economics, those sorts of broad sort of looks at policy and sort of how environmental matters play out. And then ended up going to graduate school at the University of South Carolina for a master’s in geography. Again, sort of it was an increasing focus on sort of the conflict of developing at the edge of our wild spaces as someone who came from western North Carolina and seeing a lot of second home development who wants to live on the edge of what is sort of wild and open and sort of what that sort of process is all about. And that sort of was in line with some of the work that the Southern Environmental Law Center was doing. Just coincidentally, I lucked out and they were hiring as I was finishing my undergrad degree and showed up well enough in an interview there to sort of be in line with what they were trying to accomplish in looking for a GIS analyst at the time.
EB: That sounds like such a great fit for what you studied. And I feel like a lot of people maybe come at problems like this more strictly from a GIS or spatial point of view. But I can just imagine how helpful it is to have that background in environmental policy when you’re opening up GIS and thinking about how to answer a question. So that’s really great background. Thanks for that.
JS: Yeah, sure. I mean, I would say that–just one more point in there, that working I really was focused on environmental law, I think, the sort of power of the law to intercede where maybe policy couldn’t. Sort of it’s just an extra solution.
But at the same time, I had taken some environmental law classes and I actually took a law school course while in graduate school. And that solidified that I did not want to go to law school, I’m not going to be an attorney. But that opportunity to work alongside so many great environmental attorneys at the Southern Environmental Law Center has just been great.
EB: Yeah. I imagine having that background makes it a lot easier for you to have those conversations with lawyers who are thinking about these issues and these topics around environmental law.
So I’m curious to hear more maybe as we talk about this project, about how you go about communicating these data specific or kind of spatial concepts to people who are lawyers who are thinking about this from a different lens. I think that’s a really interesting aspect of your role and the work that we worked with you on at SELC. So maybe we could jump into the project. Would you be open to that?
JS: Sure.
EB: Great. So what’s the best way to get people to the project?
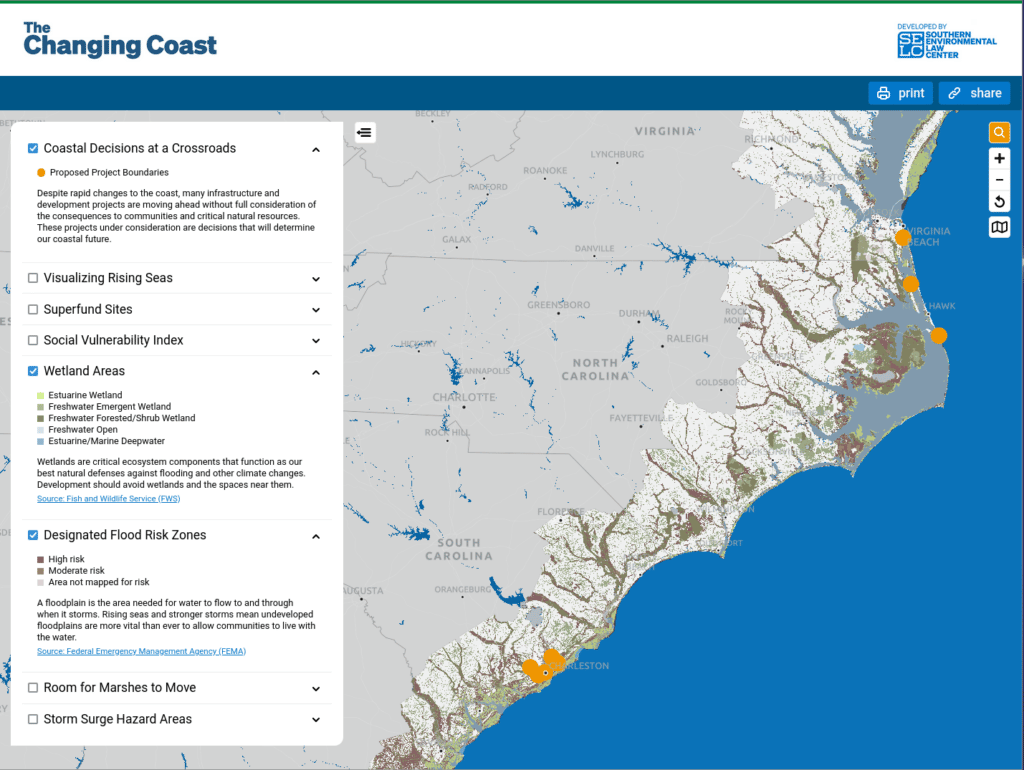
JS: So if you go to the URL, thechangingcoast.org, that will bring you to the landing page. You land on an option to jump right into an interactive map, which is what we produced with you all, as well as sort of scroll down and get some context of the issues.
So we were trying to build something that had the information and the power of an interactive map but wasn’t overly technical, and also gave some context to things like marsh migration or coastal infrastructure. What are those things? So it was sort of part educational tool, part explorative tool.
EB: I really like the way this came together. As you mentioned, we at Stamen focused on the interactive map part. But I really appreciate seeing how this landing page came together. I think it does a really nice job of adding to the narrative and explaining some of these concepts that are shown on the map, but maybe a little bit difficult to understand just looking at the map. I think that’s really great. So looking at the map itself, would you mind walking us through some of the highlights of what’s on the map?
JS: Sure. One of the things that I like most about the map is that it is bringing together sort of what we consider the more important elements of background needed to make effective decisions about coastal infrastructure. And that is part looking at the present environment and also looking at the potential future environment, and then adding into that what are the social and economic dynamics that are present in sort of how we’ve built. So sort of what’s there, where are we building, what are maybe some problems associated with where we’ve made hard decisions for building, and how can we use that knowledge to maybe look a little bit more into the future. I mean, to give a sort of–stepping outside of the tool.
One of the reasons we built the precursor to the tool is that we were looking at sort of sea level rise data in the context of, say, a long-term transportation project and sort of in ways that the required environmental review was not, and that’s us as sort of a research organization. And so we wanted to continue doing that, but also wanted to sort of extend that opportunity to other folks in our region that we may not be directly engaged with or connected with. Whether it’s just someone who’s trying to understand what’s going on in their community. But that’s back to the tool itself, we went through a process where we wanted to narrow down the features that we had there, so we have a combination of what we consider to be sort of the best available data that are consistent across the region. And I should say back up and say that the Southern Environmental Law Center works in 6 southern states. We work in Virginia, North Carolina, South Carolina, Georgia, and Alabama, and Tennessee.
And so, obviously, Tennessee doesn’t have a coast. So take the 5 states that have coast, and then we filled in the adjoining coastal states to those–so Florida, Maryland, and Mississippi–to create a buffer around that. So that’s the geography that we’re focused on, it’s not a national map a national tool, we’re an organization focused on the south. So this is a tool focused on the south. And so what we wanted to do was take those layers and each one of them is very dense and technical and abstract at the same time. With mapping we’re trying to represent our earth from a certain point up. And that means we don’t get all the detail right if we were to zoom all the way in. And so when we built the tool, we were trying to keep that in mind too. So we have this sort of component of the data layers that we can see and also a limit on how close you can zoom in. And a translation of that, I guess, is this is a community-level tool. It’s not a what is going to happen at my favorite beach house or the individual house level. It’s more of a community-level tool to understand what are the possibilities because we don’t have maps or data that tell us the actualities. These are possibilities. These are likelihoods, these are all important things to consider, but they’re not absolute sort of realities that we can predict. But we did want to bring together these pieces of information that sort of exists independently and in other tools but in one single tool.
EB: There’s a lot in there I would love to dig into a little bit more. So when you’re talking about some of the layers that maybe it’s not appropriate to zoom all the way in on, do you have a specific layer in mind, maybe like the sea level rise layer? Is that a good one?
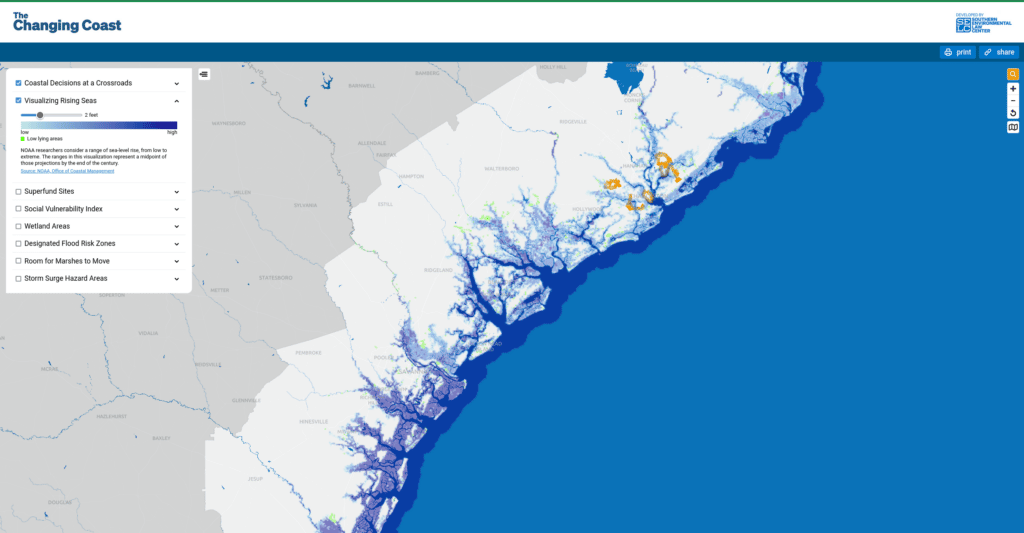
JS: Yeah. That’s a great one to pick. I mean, so the sea level rise layer, what we are using is NOAA’s sea level rise data, the same data that you see in their sea level rise viewer tool, which is a great tool, and I’m not going to claim that ours is sort of superior in any way. It’s just different. And so we were pulling in their data directly from their servers actually. That was sort of the one sort of on a technical side, the one sort of thing we had the least design control over. But anyways, what we were doing there, as we did with the other datasets, is we wanted to look at (A) how are they displaying the data on their website that was sort of the initial guidance as we don’t want to zoom in closer than they are showing the data and (B) verifying that by also going into the metadata and understanding what the scale limits are on the data. And that was sort of a decision we made across all the data. We didn’t want to go beyond the scale that they were drawn on because then they have the possibility of being taken out of context and sort of being misunderstood.
EB: That makes a lot of sense to me. I feel like, as you mentioned, a lot of this–a lot of these future-predicting layers–are models, and they have different resolutions and take a bit of interpretation. And I guess I’m wondering how you thought about interpreting the layers and making it easier for end users to interpret those layers.
JS: Yeah. I think, I’m having trouble remembering exactly where the conversations went, but I recall that being part of some of our check-ins with Stamen on that were sort of, what your experiences had been in terms of how sort of many, is there sort of a max number of layers you want to put on a map before you start losing people? How to limit the number of layers and the number of classes within each layer. And then just the very real consideration of how are you going to symbolize all that, all the sort of the cartography end of that? So those were sort of all pieces that came together for helping understand that.
EB: Yeah. As you mentioned earlier, this work is based on a previous project that you all had put together internally. And if I remember correctly, that was built with ArcGIS online, and it had more layers than we’re showing on this final project. And yeah, that was definitely the topic of a lot of conversations that we were having was narrowing down the number of layers. I remember we had layers such as permitted sites for certain types of construction, if I’m remembering correctly. And it’s simply we had to whittle some of those out.
JS: Right. I think the decision there was one where we weren’t trying to build a tool that was breaking news. It wasn’t like, “Hey, go check out this new permit.” And so that would have introduced a challenge with doing tracking sort of the permitted decisions. And those are sort of permits granted for facilities in the coastal zone as well as another dataset which looked at the jurisdictional determinations that the Army Corps of Engineers made, which is essentially the process where they go on site of a proposed development and say, “This is a wetland. This isn’t a wetland. This is a stream. This isn’t a stream.” And that sort of dictates legally how they’re allowed to develop, or the degree of mitigation they would need to do as a result of development. And so it introduced a layer of complexity that we didn’t want to be maintaining. We wanted to–we were building a tool to enable more people to look at individual projects within the lens of that background data. So yeah, so that was an easy one to sort of take off for public consumption. I think we had things like hydric soils, which we also took off as well as managed lands. I think that sort of ended up being captured somewhat in the base map anyways, and hydric soils sort of got covered with, for the most part, by wetlands, and we didn’t want to introduce the concept of hydric soils and wetlands in the context of the map. Again, keeping it at a level of understanding where the water is now, where the water might need to go and how to not get in its way.
EB: That makes sense. And so you mentioned how this tool is focused on the Southeast of the US. And I wonder, aside from limiting the geographic scope of the map, I’m wondering if there is anything else that that focus led to on the map in terms of data availability or other decisions that you all made. I’m thinking, obviously one of the layers is proposed projects that SELC is looking at that are proposed that might not be good projects environmentally, that they might push back on. And that’s clearly going to only exist in the area that you all work in. So that makes sense. But I’m wondering, are the rest of the layers global or for the whole US, or were there any other decisions that your geographic extent had an impact on?
JS: Sure. Most of them were global for the US. The national wetlands inventory, the EPA Superfund sites, some sea-level rise, and the storm surge potential models, those obviously stay–they’re nationwide, but just within the coastal zone. Probably the only one that I think produced the greatest challenge was working with–and this was the one sort of non-governmental data that we used–was labeled “Room for Marshes to Move” in our map. And that is actually from the sort of extensive and really wonderful mapping that The Nature Conservancy has done on coastal resilience and climate change at the landscape level, in general.
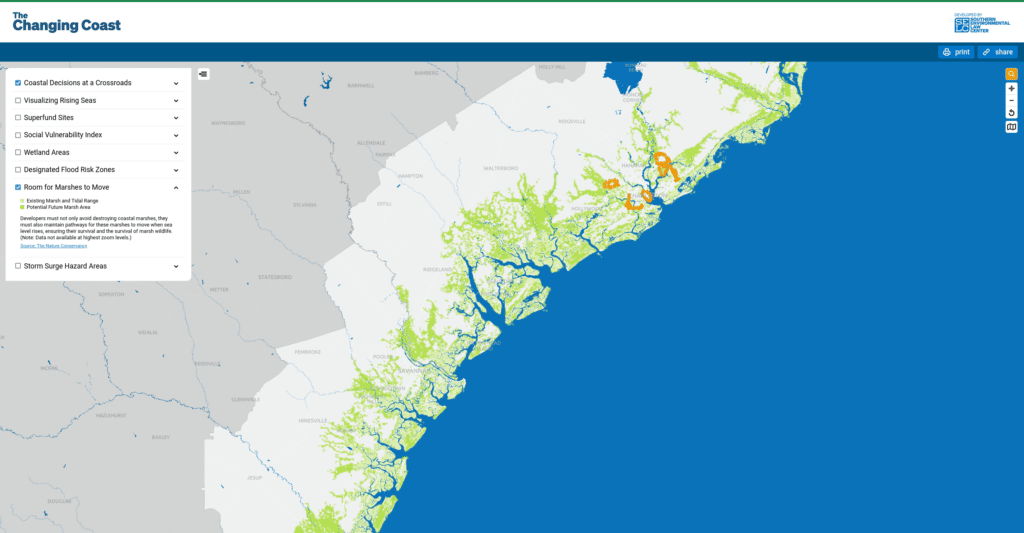
And the only challenge there was that them being another nonprofit, one that does a fantastic job at promoting great ecological sciences, we were dealing with datasets that had been done at different times and assembled there, particularly. But they worked with us on that, sort of the edge of ecoregions being what comes out through the Chesapeake and then what is south of there. Those were sort of the extents of two different mapping efforts that they did at sort of slightly different resolutions. And so that presented a little bit of a–probably the only–challenge in terms of trying to make sure that we were symbolizing the data in a way that accounted for sort of the potential discrepancies and overlap. And they were just fantastic in doing that. Shout out to Annaleigh Barnett, who answered a lot of our questions along the way and helped sort of formulate the data in a way that was most useful for dropping into our map as well.
EB: That’s great to hear. I feel like, as we know, looking at a map like this, it can look–if we’re doing it right–it looks simple. And just knowing how much effort goes into that one layer that we were talking about, the room for marshes to move, I think that’s really nice context for people who maybe aren’t doing this work that intimately. Thanks for sharing.
JS: Yeah.
EB: So I guess now we know a little bit about how the map is structured and the kinds of data that are represented on the map. I’m wondering how you expect people to use the and if you have any examples of people using the map.
JS: So I mean the hope is that enough people will learn about the map to be able to use it and apply it to their own problem-solving. I guess an ideal case would be: you live in a coastal community in the southeast and maybe not focused on a coastal community on the beach, think of coastal community that’s maybe on a tidal creek on sort of the lowlands a little bit farther in, maybe not as sort of built up of an area as you might consider when you think coastal development but an area that’s in sort of people have lived in low lying near and at the edge of flood plains.
And there’s a proposal to put either a large-scale sort of residential or mixed-use development there. We’re talking thousands of acres types of deals, which have a major change on the landscape or could be a road project that’s sort of maybe a little bit narrower in width but might cover 30, 40 miles or something like that in some of their bigger approaches. What we want is for someone who is in that community and just finding out what is going on, whether it’s sort of a public meeting or even worst case, a potential condemnation of their land for eminent domain or something like that being able to look at–not to be stuck with just the maps that the development entity is providing, which is sort of, “This is what we want to build. This is what’s going to be here. This is why you need to move.”
What we’re interested in bringing into that equation is what does that mean for the livelihoods and the people that live there already? What does it mean for the potential future of the environment? And from whether that’s the species or the people living there, we’re talking about a holistic environment. Our coastal resilience work is built on a three-pillared approach of protecting nature, safeguarding communities, and looking at smart infrastructure and nature-based solutions. So that is the context of the background information that is on the website as well.
So we want them to be able to come in and learn about the range of coastal resilience issues, whether it’s some issues in there that are, again–we weren’t able to really tell a story with the data, but they were very important to our work–things like inequity and FEMA relief distribution and matters like that that we wanted them to be armed with enough information to not feel like they didn’t have a choice and to help facilitate their organizing capacity if possible, whether it’s just an individual who wants to know more about their coast, whether it’s maybe a reporter that was another sort of target audience of ours. And we had a few interviews with reporters following our launch that were sort of curious about the tool and trying to learn how to use and sort of with the other audience, I would say, is local and state decision-makers actually had to honor a week or so ago to present about this tool to the Southern Regional Environmental Legislators conference, the conference of state legislators that met in Atlanta, state legislators focused on environmental issues. And so in that instance, it’s trying to just make them aware that the tool is there and can help them engage sort of their own research questions as well as their constituents, sort of providing a means there. So those are the three ideal ranges of empowering the individual and the local level decision-maker and also, the person who is maybe not local, but is trying to tell the story of what’s going on locally.
EB: That’s a great breakdown. Thanks for that. I guess I’m wondering if you feel comfortable digging into an example of how someone in a local community would come to this map and use it. I was thinking about–you mentioned, say, for example, a large-scale residential development is planned in your area. I’m wondering maybe are there a few layers that you think would be particularly useful when looking at that just to just to give an idea of how someone might come here and make use of that?
JS: Sure. I mean, I think it’s going to depend a little bit on–obviously, the geographies of everything have their own uniqueness. But generally, you want to know something like–if the proposal is that, “Well, in X thousand acres of land, we’re going to disturb 50 acres of wetland,” that’s not much. But maybe where those 50 acres are matters a lot or maybe those 50 acres–if they go, you’re also losing the ability of the natural environment to migrate via marsh migration as sea levels rise and the terrestrial ecosystems move further inward along with the adjacent aquatic ones. You might be losing the opportunity for 100 to 200 more acres of that. You may be introducing, “Hey, this is all in a floodplain.” I mean, this is not necessarily a major focus of the tool, but it’s a related aspect of some of our work is trying to understand what is the risk to the owner building there? Why do we keep building in these areas if they’re just going to be flooded–if they’re already getting flooded, if they’re only going to get flooded every year or more and more? Where is that disclosure being passed on to the homeowner? And maybe that’s not necessarily the approach of someone who’s already living there. But it is part of that broader development decision of as we’re developing, are we just building for–we can’t build walls around the advancing seas evermore. Those are temporary solutions and what that are–each temporary solution lasts less time than it used to as well, just because of the rates of change.
EB: Those three layers in particular, that makes a lot of sense to me. The wetland areas, room for marshes to move, flood risk zones. I mean, I’m curious–I’m sure it depends on where you are, state-wise, and locality-wise, but are there examples of, say, laws or particular kinds of leverage that you can get if you can show, hey, this development is in an area that is a wetland or this is an area that could be a marsh in the near future, or we need it to exist to be one in the future? Does that give you much leverage legally? Or is it just a part of your argument for or against the development?
JS: That’s a great question that I don’t know if I can–I’ll attempt to answer. But as an attorney, I don’t know how that really translates to legal leverage. But as far as communicating what the issue is, a lot of things proceed legally and legislatively because they’re not understood as destructive, for example. Or to be fair, maybe it’s that we don’t understand both the destructive and the potential and what that difference between those two is. And so with a tool like this, we are trying to equalize the information that’s available and be able to ask good questions along the way. Whether that’s, again–so these are the things that we as a research organization have done with our own approaches to GIS–and the challenge here was make something that can extend that access to the public. So sort of circling back on what I think the original question was, I think it can probably strengthen our legal arguments if we have–or certainly, in our own applications, if we have a well-designed sort of map that is based on valid information and then, defensible methods. That has worked well for, I guess, helping us make stronger arguments. You’re appealing to sort of having a map in the courtroom is trying to stand against someone who is trying to explain an issue without a visual is–that has worked to our advantage on many levels because you appeal to broader levels of just sort of how humans as a breadth of people understand and dissect information or consume information. But so yeah, I would say it’s definitely part of our strategy to communicate data visually. And most of that is mapping. But I’ll sort of back away from being able to answer sort of exactly how legally pertinent that is. I’ll leave that for the attorneys but they sure do keep coming back for more maps, and more tools, and analysis to support and strengthen their cases. So there’s a very strong correlation, there.
EB: To be clear, I wasn’t asking for legal advice.
JS: [laughter] Right.
EB: I guess I could see, I’m familiar in some ways with environmental impact surveys, studies, that kind of thing. And I could imagine something like this maybe–obviously not being the depth of a full study, but it might give you a way to take a quick glance at a possible project, and see: is this work digging into more? Or are there particular aspects of this that are particularly troubling? That makes a lot of sense to me, to have just a quick reference that way before you break out your GIS tools, and start surveying to that.
JS: Yeah.
EB: Yeah, that makes a lot of sense to me. And I guess– okay.
JS: Oh, I was going to say, you make a good point there about just–not just our tool, but most interactive maps out there in general. And sort of I classify a lot of them as screening tools. They’re not tools that give us the exact answer to a decision. They help us make more informed decisions. And a lot of times, they raise new questions that we need to answer. And maybe that procedurally slows things down, but it also helps us make the best decisions to consider the range of impacts. The other great challenge out there, in the context of this, which we’ve sort of tried to build into our map. But there really aren’t great data out there on the level that we need it.
And that’s the socioeconomic impacts, you know? The environmental justice screening. And same thing, I think the thing that folks want is, this is maybe the hardest part of the job. Is that folks want a discrete answer you cannot give them on a constant basis. And the attorneys that I work with understand that, and partners understand that. But it makes it sort of very challenging to sort of define that limit. Of course we want to use these data and these maps to inform our decisions. But they can’t tell us exactly what to do. For that reason, most–and this is, forgive me if I’m going off-track–but a lot of what I do is, we don’t have the data to say whether or not an environmental law is broken, is being broken, or will be broken, exactly. We just don’t collect data on that level. I wish we did, from EPA, we kind of know where facilities are, but we don’t necessarily know discretely where the pipe from where the treated waste water goes back into the surface waters. We don’t know that discretely. We know maybe within 100 yards or something, or maybe even more. Or we don’t have a great idea of what chemicals are in the ground where. That data doesn’t exist en masse and being able to be pulled off the table and the same with–and that’s sort of what I would call legacy pollution, and then you have sort of the sort of newer wave of ongoing pollution of trying to understand what’s coming out of–do we just monitor air with these stationary monitors or do we need to be doing a more holistic approach to air quality with mobile monitors?
On a recent other project, we helped a partner produce sort of some survey areas for an organization called Klima, I think, is their name, and they’ve sort of our mobile air sensors. They drive around and then help collect the air quality across the community to show what air quality is like in areas of large metro areas that maybe don’t have the infrastructure or sort of the EPA level monitor in place and that sort of disconnect between how are the impacts really playing out and on whom? We’re really just at the cusp of starting to understand that. There’s certainly more momentum of folks trying to understand that and some cool data tools that have come out with that. Forgetting the exact name of it now, but ProPublica put out a great interactive map last year about sort of these major emitters and sort of cross-referencing that with health risk.
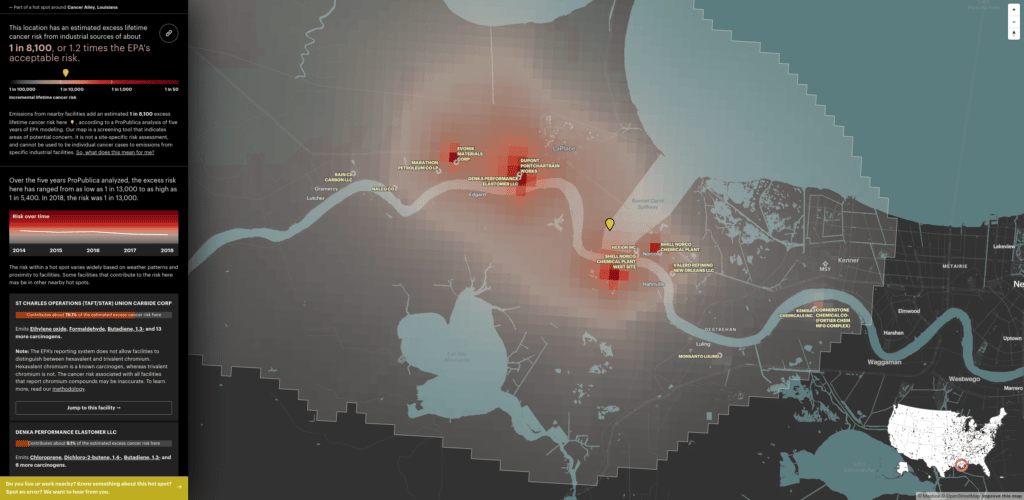
Again, it’s not an exact tool. It’s not going to tell you who exactly is getting sick, but it certainly helps you focus if you’re trying to start at a state level or a metro level like where would you focus resources and that’s where, again, continuing on this aside, that’s where I really wish sort of we had more resources going is into mapping sort of the scope of pollution and the scope of who’s living where. Well, let me rephrase that, because it is a fine line there with privacy. It’s less about knowing who lives where, but about being able to accurately portray the spatial weight of risk to our decision-making process. It’s something that’s not a generic unit, well, not generic, but something more relatable to community than say a census tract. A census track being where we do a lot of our analysis. Census tracts and zip codes are sort of–but neither of those are community units. And we use them to– that’s where we have our data, but we’re trying to translate that to community level and the result is you’re going to miss maybe some of the most impacted what we call frontline communities, I guess. Those right on the edge or that will be right on the edge of the impact. Maybe in the scope of a census tract, the whole census tract is not disproportionately impacted. But that place where the pipeline and the compressor station are going to go just happen to be one of the most sort of vulnerable populations of the of the tract.
EB: I think, yeah, that’s a great point, who knows which– I feel like people don’t know which census tract they live in when you’re looking at a map, but also depending on the area you’re looking at tracts can be large. They can be weird shapes. I think that’s a great point that you don’t necessarily know what the makeup is aside from aggregated to that tract. I wanted to go back to something you mentioned, though. I feel like if you’re not making maps and working with GIS, it’s easy to assume that all the data exists and is just there and you just have to download it and make a map out of it. And I’m wondering, have you built tactics for talking through that with someone who doesn’t fully understand what the process is? And also I don’t know if you have any tips for looking for the data that you do need. It sounds like you have some good connections with some people who provide data, which I’m sure helps.
JS: I mean, I wish I had a better go-to answer. [laughter] It’s so individualized. I’ll give the example of water data. We know when you say, “I want to map streams. Where are the waterways?” We know that from a government dataset called the National Hydrography Dataset, which is a digital translation of the older, paper, USGS topographic maps. And the issue there is there were ways that lines were drawn on maps, giving them sort of terms that have legal significance but it’s not a one-to-one comparison. It’s not a regulatory thing. And so I say it’s–I guess I would say I’ve evolved from trying to divert from a project of, “Well, the data don’t let us do that.” I mean, that answer is still in there, but it’s more about like, “All right, well, we can’t analytically pin this, but we can probably graphically and conceptually pin this and can we do that in a way that is going to explain this?”
I mean, that’s happening in real-time with the ongoing work on the federal level of what is the extent of the Clean Water Act? What is a jurisdictional water that the rules apply to and what is not and that is probably some of the most important work that I think I’m involved in and at the same time, it’s essentially to know the data so well, you’re essentially talking about rules that apply to data that are completely absent from the dataset. And to give an example of that essentially ephemeral and intermittent streams and headwater streams. Sort of the things that are not flowing all the time. They may flow seasonally or sort of for a very short period of time in the year or maybe just in response to precipitation, but they are very important connected sort of arteries. Maybe arteries is the wrong word because they’d be smaller. I think, to me, the metaphor is sort of to the extent that a river system may be like a set of lungs. It’s all the things you need to take a deep breath when you’re most fatigued, sort of. And how we regulate those matters because they’re still conveyances of pollutants to the waters we use on an everyday basis. And significant conveyances of those for that matter. And so, it’s one of those that, I think, it keeps me up at night. It kept me up last night. It doesn’t sort of stop, but it’s so important to sort of not–to take that additional step from a data analysis perspective. GIS data aren’t going to give us this absolute policy difference. So how do we–what can it tell us and how can we frame that? So it becomes a discussion about what the objectives are of the legal case, and also–our organization focuses a lot on communication of issues sort of that we are working on legally.
So there’s sort of what are we writing into the legal text and also what are we writing into making that understandable to folks that are just interested in the issue or folks that may be contributors to SELC and really want to know sort of deeper details about what we are able to do. So I think it’s just–maybe the refrain is a plea for them to continually reach out to say, “Let’s talk about this. Let’s come up with a solution.” And yeah, I’m not sure if I took that in a different direction than–I forget where the question originated at this point.
EB: No, that’s perfect.
JS: I do that a lot. Yeah.
EB: Yeah, I think that makes a lot of sense to me. I guess with a problem like that, my head goes to, well, specifically thinking about intermittent waterways. Is it sufficient to zoom really far in and map a couple of small areas to better understand those smaller areas, or is it something that is modelable? Have people modeled that? But I feel like otherwise, that makes sense to me that it’s an ongoing conversation with the people who are working on that. And yeah, I guess it’s your job to communicate with them what’s available and what’s possible.
JS: Yeah, I mean, it’s–and I think to an extent the laws, maybe not the laws, but some of the ways that there is flexibility in how the agencies apply the laws. And I think that makes sense on the level of that if you look at the scope of our country, an ephemeral stream in the southeast or the sort of Great Lakes region versus the great basin sort of, they’re not the same ecosystems. And so there is some sort of difference in how those different sort of regional offices of, say, the Army Corps of Engineers may break down and interpret that. But I think the issue there is that we have–maybe we need a more clear sort of understanding of sort of why the waters matter to us, and what that role is. I feel like I’ve lost my train of thought there from–what was the, what was the leading question again?
EB: Yeah, I was wondering if it makes sense to, as you were kind of hinting at, like, zoom in to a smaller scale. Like, it matters whether you’re in the southeast versus the southwest, for sure. How important this stream is or what kind of impact it has if you disrupt this stream or develop on it or something like that. I think that makes a lot of sense as you were getting to. Sometimes I imagine there are proxy datasets that you can use to say, well, maybe we don’t know exactly where these intermittent streams are, but here are the other factors that we should have in mind. These are the areas that we want to keep an eye on for this particular thing. I don’t really have as much expertise in the exactly what those would be. But I think that makes a lot of sense to me in terms of communicating with people who maybe aren’t GIS every or data savvy.
JS: Yeah, I think so. I think it’s probably more important from a communications perspective to present people with as clear and defensible of an image as possible. I think from a GIS and a data analysis perspective, we’re always going to say too much. Here’s this detail. And this is what this really means. And this is what it means. And it’s important to document that and to be able to explain that and to make sure that you have a solid basis for what you’re saying. But as far as communicating, I think both things have their place. If you’re talking about a very sort of localized thing, then you wouldn’t want to use model data. But if you’re trying to extrapolate impact on a sort of watershed scale and I’m talking sort of maybe 8-digit hydrologic unit code, this sort of scan multiple counties type of watersheds or even the state level. And you have to do model data because data are far too noisy. It’s just sort of a loud message. You need to have a way of modeling it and depicting it in a categorized fashion. So I think both really have their place and you have to sort of know where that sort of balance is between using it and not. I think that the most dangerous is that would be that, and this is why we built the tool that way that we did is that you don’t want to go beyond modeling the sort of scale that data were drawn at. They start to take on a very different meaning, whether it’s a US map that has a sinewy Mississippi River versus one that if you draw that same sinew and you were to narrow in on sort of the lower Mississippi, it would look very, very wrong in terms of the actuality, but it gets the point across for the realm that you’re at. And so–
EB: It’s a great example–
JS: –yeah, that balance point. Yeah.
EB: Yeah, both at a spatial resolution and a temporal resolution, because that changes over time, especially as you zoom in. I like that a lot. Thanks for that. So I think we’re at a point where maybe we want to talk about the future. I’m curious to hear what the future is for this project and what other kind of work is coming from SELC.
JS: Sure. For this project, our attempt is, again, to sort of build something that’s kind of evergreen, that this is going to live for–we’re not going to be updating this on a regular basis. Maybe twice a year. We’ll be looking at: are there updates in the data that we’ve built into it that we want to make sure to get in there? Are there sort of new information about the sort of the coastal decisions at a crossroads that we want to add to? Because what we’ve represented now is a set of issues that we think matter. It’s not a set of, these are the things that we have won in court or will win in court. We may lose them in court, but they’re the battles that–they’re illustrative of the battles and the types of battles that we want to be sort of fighting. And so as far as the future of the tool it’s I’m hoping to just find it more folks that are using it. And also to sort of get on the road a little bit with it. Fall conferences are coming up. I’m looking at maybe sort of probably putting together a presentation to talk more about this, and I think the opportunities that we need it’s sort of maybe not to take this to the GIS conferences, but to take this to the more regional conferences where you might be put in touch with the users and the potential users of the data.
EB: I was thinking that too thinking back to you talking at a legislative conference about it.
JS: Yeah. I mean, that may have been the most sort of–that was a great sort of success, I guess, of–they reached out to us and had seen the tool and were interested in it as an example of sort of how we want to think–well, think broadly about how we’re approaching infrastructure on the coast. That was the panel that I was a part of. And so yeah, that was a sign that it was out there. It was on the radar of what’s actually a national-level group of environmental legislators, a sort of state environmental legislators. And so that was a great opportunity to just sort of introduce it to some folks that are working on it in coastal Georgia, coastal North Carolina and let’s say, I guess for the benefit of going back to the tool: coastal is not just the beach. Coastal can be a hundred to 200 miles inland in some areas, especially in a state like North Carolina or Virginia where you have the Chesapeake Bay. You can have the tidal influence goes way in and beyond the tidal influence you have these deep flood plains. A storm surge in a hurricane or a sea level rise has significance well beyond the beaches.
EB: That’s a good point. It’s easy to forget looking at, say, an outline of the U.S. kind of going back to what we were talking about with the Mississippi: yeah, the coast comes in quite a bit. I feel like looking at the wetland areas layer on this map is a really nice reminder of that.
JS: Yeah. Yeah, I mean, and so that’s the national wetlands inventory, which is just–it’s the only nationwide dataset we have that is mapped our wetlands. And it’s not exact. It’s not precise, but it’s pretty good. And we show it at the scale that it’s meant to be shown at. So we don’t let it get past the scale where inaccuracies might pop up. And it’s not going to show you absolutely every–none of these maps can show you exactly what’s going to happen–but they can show you a lot more of the things together and side by side that you might not otherwise see if you’re just accepting one side of information. Or expecting that the review from the environmental agency was thorough. And that’s not necessarily to be a dig at environmental agencies. There’re lots of great scientists and analysts and folks working there and putting together this work. But they’re sort of–there’s an extent of what they’re required to produce. And so part of what this fills in is maybe another role of what we do on the sort of more extensive side at SELC and that’s to produce maps and analysis that build on the public record of what–this is more of a legal strategy type thing, getting more information into the record for major decision-making that we believe the government omitted either just for the scope of, they weren’t required to do that or just they weren’t looking there or–I’m not trying to assign reason to that, per se, but it just to give folks sort of their own eyes on the issue
EB: That’s a great framing, and I hadn’t thought about it that way until you said it. But yeah, either way, that information is missing from the record and you all are helping to make sure that it gets there. That’s great.
JS: Yeah.
EB: And I guess that makes me wonder about if there are any other future mapping projects that you’re able to talk about or that might be of interest?
JS: I think I alluded to maybe a little bit earlier in the places I wish we had better data. I think those are the things that I’m most interested in because they are so intersectional to the issues that we’re looking at. So our organization has programs within it that focus on laws of water, laws of coasts and wetlands, laws of the air, laws of sort of land and community development, of wildlife forests.
And what I’m interested in now is sort of, and sort of what we’re looking at is, taking a more holistic approach to those overlaps. Because as we look at programs that have been focused on those and we’ll continue to focus those but we want to make a more sustained effort to capture the connections across those. And those are going to be in the realms of climate change impacts and in the realms of environmental justice.
And those are two areas that are relevant across the board in those. And so that’s I think–I don’t think I could name a specific case, but I think that’s kind of how our organization approaches things. What are the matters that need addressing environmentally? I guess maybe I skipped over that earlier, but we are trying as an organization to make legal challenges that set positive precedents for environmental laws and can lead to further sort of ongoing clarity and positive environmental decision-making.
If I can back up to the beginning here, our mission statement is to protect the basic right to clean water, clean air, and a livable climate to preserve our region’s natural treasures and rich biodiversity and to provide a healthy environment for all. And all that is couched in this idea that we are a very–we’re bigger than a lot of national and environmental and international environmental organizations but we’re focused solely on the south. And we think within the United States that’s certainly an epicenter of a lot of these issues and where the impacts will be felt the most, whether we’re talking about moving toward a clean energy economy or addressing climate change.
And doing the work and investing here, it leads to solutions that have national relevance, and so one thing that we say a lot now is, “solutions start in the South.” And so that’s the context of where we’re going is trying to build that momentum to–these are great places to approach these national issues and to get the momentum going and to sort of be leaders on that nationally.
And sort of my own, I guess, personal approach to that is to just sort of, as SELC is a leader in environmental law, that my role is to make sure that geospatial science and in maybe in a broader sense applied science are applied to that, and that we can be leaders in getting the right information into and communicated effectively within the context of that environmental legal and policy work that our attorneys are driven to do.
EB: And I imagine as part of that, you’re potentially setting legal precedents that impact the rest of the country, right?
JS: Yeah. That’s right.
EB: That’s great.
JS: So a lot of it deals with federal laws and goes through the federal court. So there’s plenty that happens at the state level too, but that can also set a precedent for a policy that can be replicated on by another state.
EB: Well, I appreciate that it is at times difficult work to get right. And I imagine that it could be stressful sometimes making sure that you’re getting the data right and getting the science right while you’re making these legal arguments, and I’m really really grateful that you’re there doing that work. And I’m grateful for you taking the time to talk through it with us, Jovian. Thank you.
JS: You’re welcome. And I’ll reflect those thanks. I’m thankful for the opportunity to work with you all to have learned about Stamen through the NACIS Conference. That’s been a big sort of part of my professional journey of just making that mecca there the last 10 years or so. Not every year, but most years. And seeing that wave of what’s possible for communicating data, whether it’s through what graphic journalists are doing or data journalists are doing or the sort of academic wave of cartography, and what we’re teaching and how.
Or just the amazing–pushing the edges of what can be done or possible. Just fun cartography and flipping the world into ways you didn’t think about looking at it. So again, shout out to NACIS and that inspiration. And Stamen, as a result of that, we’re happy to have the opportunity to work with you all and feed off that creative energy.
EB: It’s been a pleasure working with you all and talking with you today. Thanks again.
JS: All right. All right. Thanks, Eric.