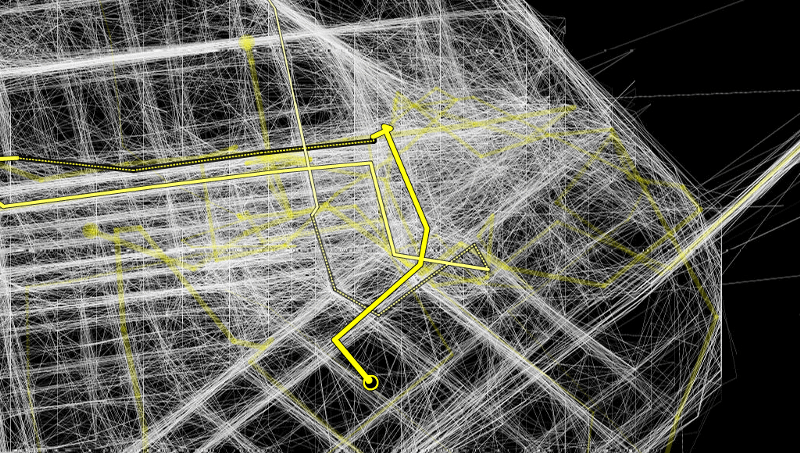
When the Exploratorium and Scott Snibbe approached us in 2005 to visualize realtime GPS positions of San Francisco taxi cabs in the Cabspotting project, we leapt at the chance. Taxi data is highly dynamic, mappings of it change noticeably from viewing to viewing, has an easy reference to the real workd, and the data lends itself to visually inspiring and meaningful work with the lightest of touches from us; all things we like.
It also suggests a wide range of potential new questions to answer and new things to make. Adam Millard-Ball’s suggested applications for just about everyone: taxi drivers (how long is the average wait for a pickup in this neighborhood?), taxi passengers (obviously, where’s the nearest taxi, but also do they tend to be here at this time), TLC planners (do we really need more taxis in North Beach? the data’d tell you), and city planners (looks like alot of people are taking cabs at 8:50am from Point A to point B, maybe we should have a taxi stand or ride share there?).

From the beginning, we made a deliberate decision to map only the data — to let the material we were getting from YellowCab tell the story, and not to rely on any kind of overlay or specific relation to an underlying, pre-generated map. We wanted to see what story the data itself would tell. It resulted in some pretty interesting artifacts; in particular the activity around the Bay Bridge between San Francisco and Oakland.
