
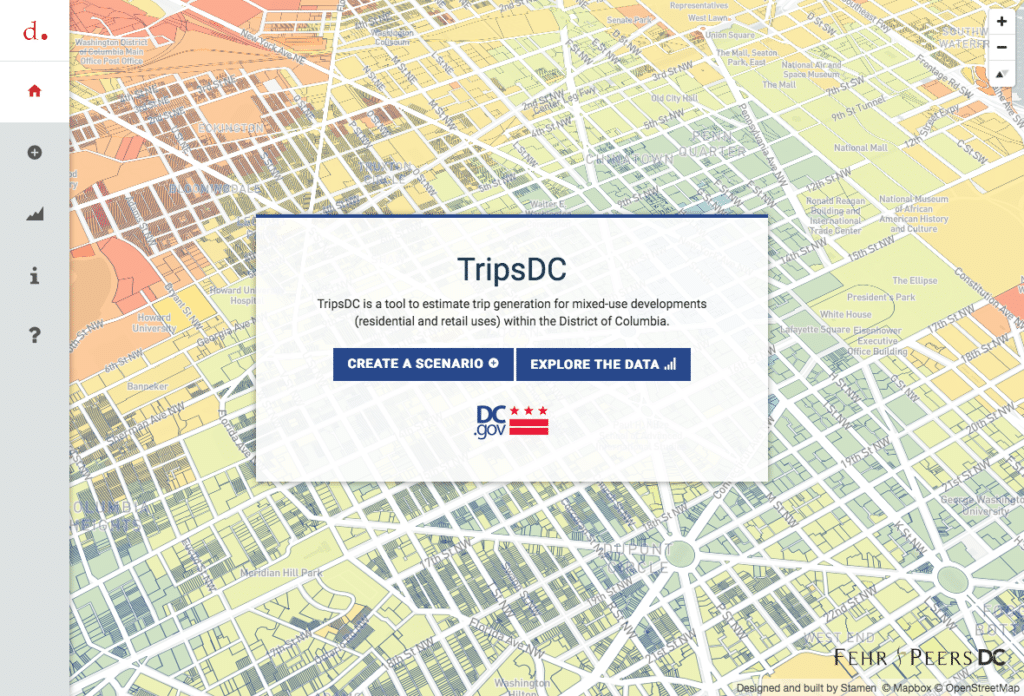
We recently launched a new tool with transportation consultants Fehr & Peers and the District Department of Transportation (ddot). TripsDC is a tool for generating trip estimates for mixed use development projects in the District of Columbia.
Most transportation models tend to assume that a development is either retail, or work space, or housing, and so they don’t really account for the different kinds of traffic that result when a mixed use development goes into a neighborhood. This tool aims to fix that.
Mixed use development projects are increasingly popular in the District (and elsewhere), typically a combination of work space, ground floor retail, and housing. Most transportation models tend to assume that a development is either retail, or work space, or housing, and so they don’t really account for the different kinds of traffic that result when a mixed use development goes into a neighborhood. This tool aims to fix that.
Trip generation estimates are the first step in transportation impact analyses for development projects. They provide estimates of the number of trips, by mode (walking, biking, metro, etc.) produced or attracted to by a given project.
Traditional trip planning models (such as ITE) fail to take into account other modes of transportation aside from cars. As a result they underestimate the volume of trips a particular project will generate. TripsDC uses a localized version of a model developed by Fehr & Peers DC. Developers must provide trip generation estimates as part of their project planning process. In the past this required the use of an Excel-based tool. Now developers in DC can easily run Fehr & Peers’ model using the web application we built.
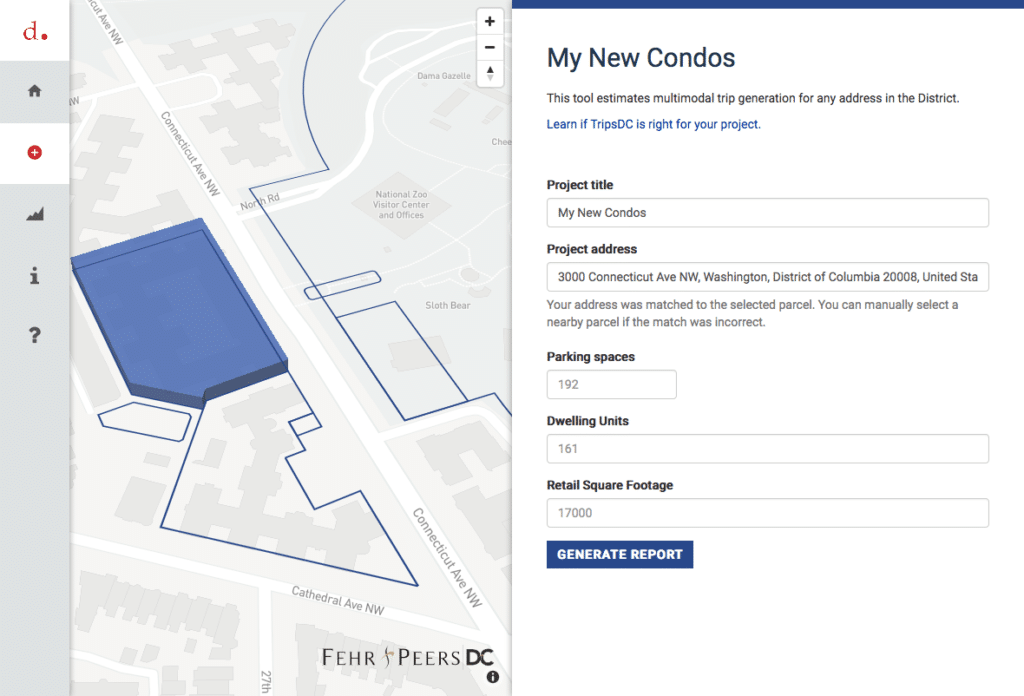
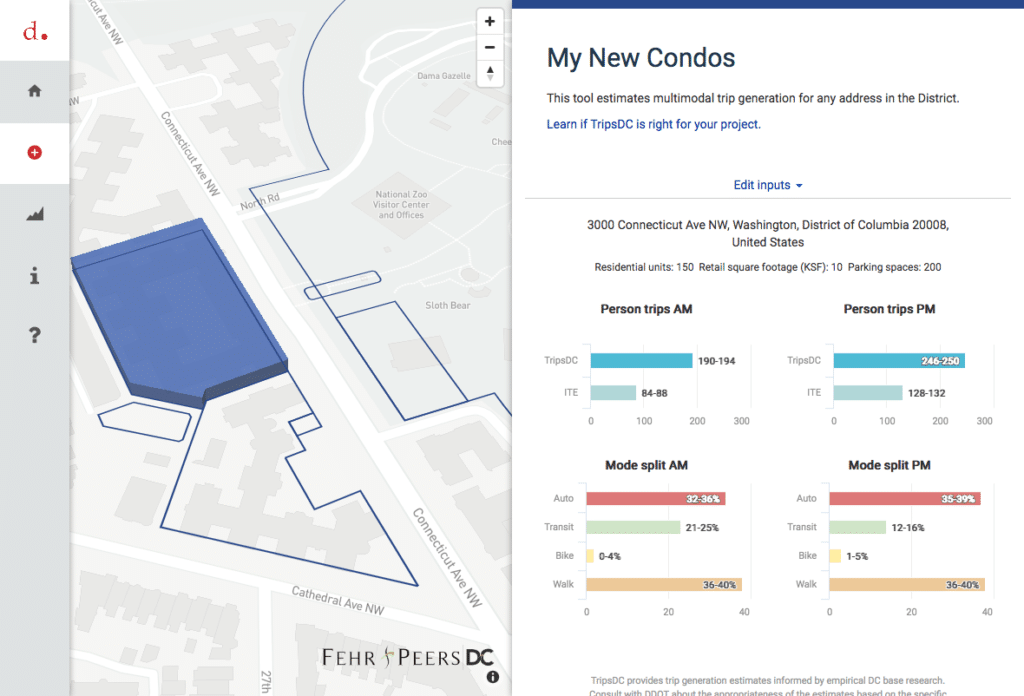
To create trip generation estimates, users input the address of their parcel, the number of residential units that the project will deliver as well as parking spaces and retail square footage. These variables are then combined with a number of input variables, including distance to the nearest metro and transit service intensity, to produce both morning and evening trip generation estimates. The tool allows users to export their results to include with their development proposals.
As part of the project, ddot were keen to also visualize a number of the model’s inputs and outputs. These maps help shed light on the current transportation context in the district.
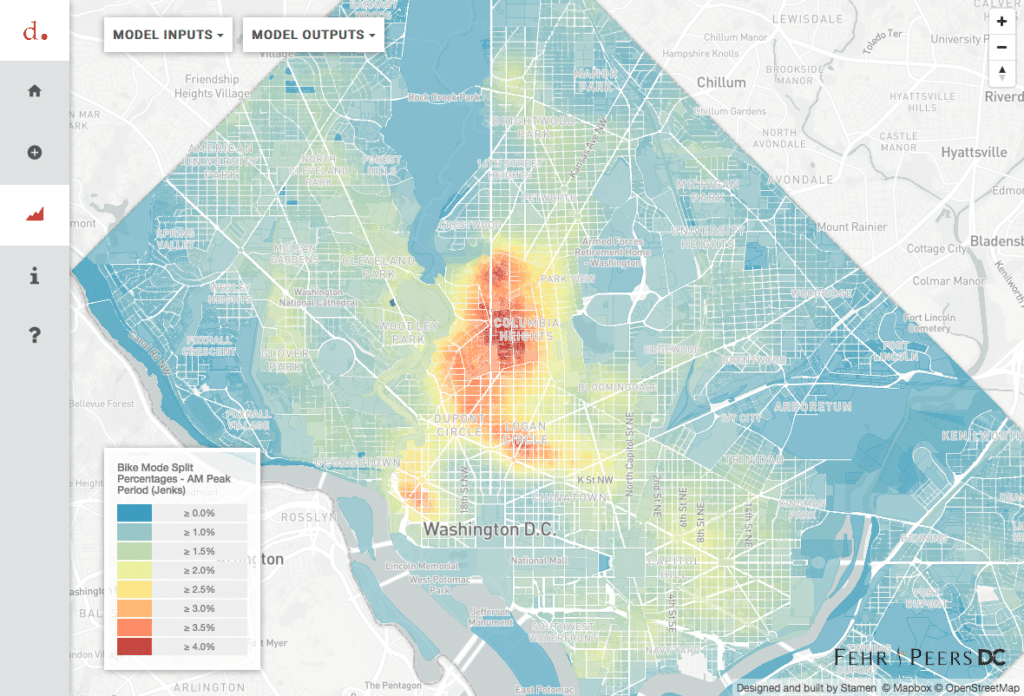
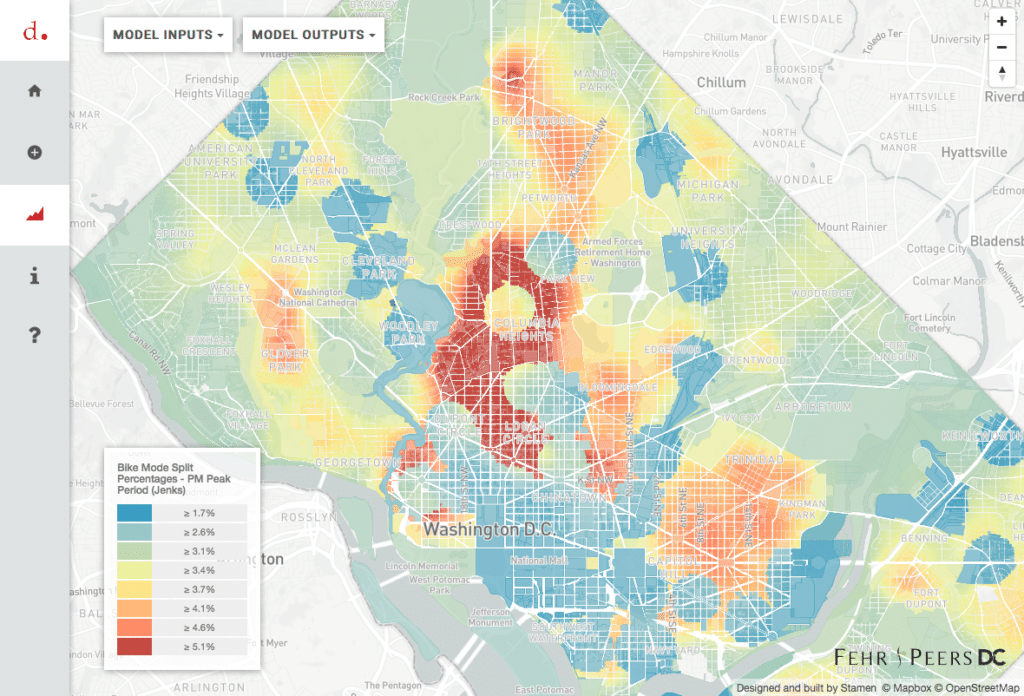
Delivering these at low zoom levels (so the user can see the entire District) was also the most challenging part of the project. To do this we needed a way to render all 130,000+ parcels without dropping any geometry. As we’re dealing with a sizable amount of data in a small geographic space our vector tiles pushed the size limits of Mapbox hosting. We ended up spinning our own tile server using Node.js and Tilelive.
Projects that focus on city infrastructure are something we really like digging our teeth into here at Stamen. We’ve looked at everything from how to best algorithmically provide water and electricity to informal settlements to travel times in the Bay Area to the spread of AirBnB in New York & San Francisco.
Looking at a surge in sea level, housing prices, and seismic risk and thinking about how to lift up resilient Bay Area communities. See our Team Uplift's presentation this Wednesday morning: https://t.co/qBGsOpIYQc pic.twitter.com/J5fc3AppgY
— Stamen Design (@stamen) November 14, 2017
This week we’re presenting on our look at a surge in sea level, housing prices, and seismic risk and thinking about how to lift up resilient Bay Area communities showing our work as part of Resilient by Design. The presentation will be live streamed on Wednesday morning, check it out! And if you’re interested in taking a new look at how cities function and have an interesting project, or know someone who does, please get in touch.