Last week Mike and I were invited to speak at the Jet Propulsion Lab for “Visualization: From Data to Discovery,” a conference about the overlap between data visualization and science.
Which would have been interesting enough on its own (because science is awesome), but the icing on the cake was a tour of the Labs. We got to spend some time in the control room where the Mars Exploration Rover is controlled and check out live updates from the Voyager space probe (64k of memory, 35 years old, almost interstellar, totally bad ass).


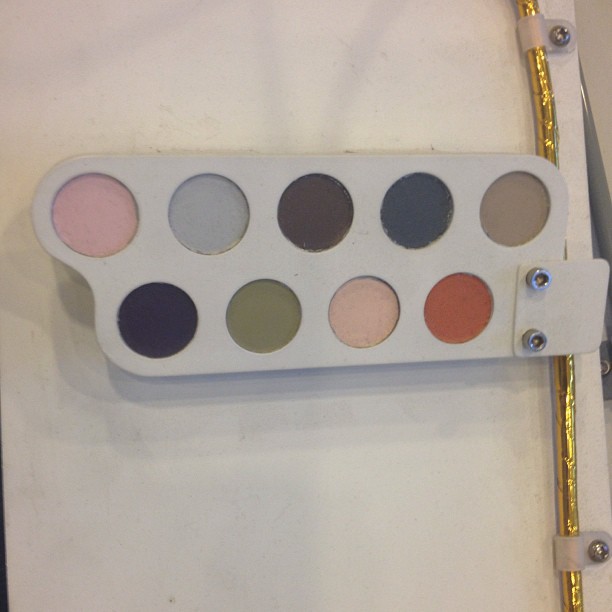
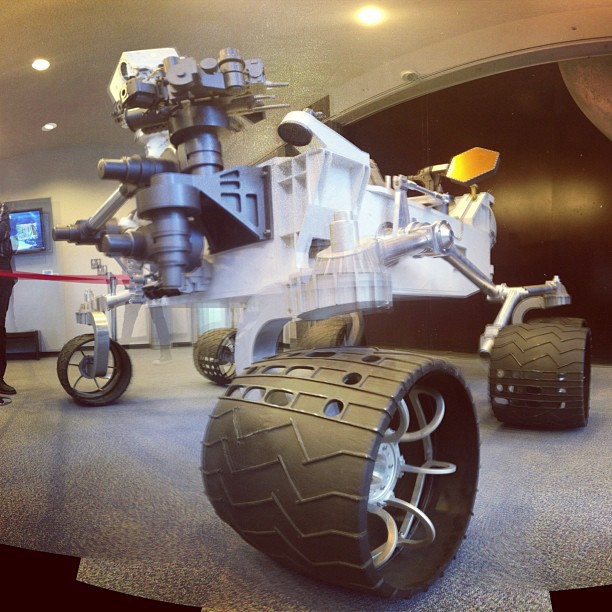
We also took a close look at Curiosity, which has paint chips attached to its back that the onboard camera can use to color correct itself. The probe also has holes in the tires so the dust can fall out. As it drives around, these holes are visible in the tracks the rover leaves behind.
These markings can be used to visually determine distance travelled. Originally the holes spelled out J-P-L. This didn’t go over well with NASA, so now it’s — wait for it — Morse Code that spells out…J-P-L.
As a small gesture of thanks to the scientists who are working hard to do science and communicate with the public despite the stupidsequester, we’ve put together a 3d contour map of the Martian surface, using data collected by the Mars Orbiter Laser Altimeter. You can take a look for yourself at http://maps.stamen.com/mars.
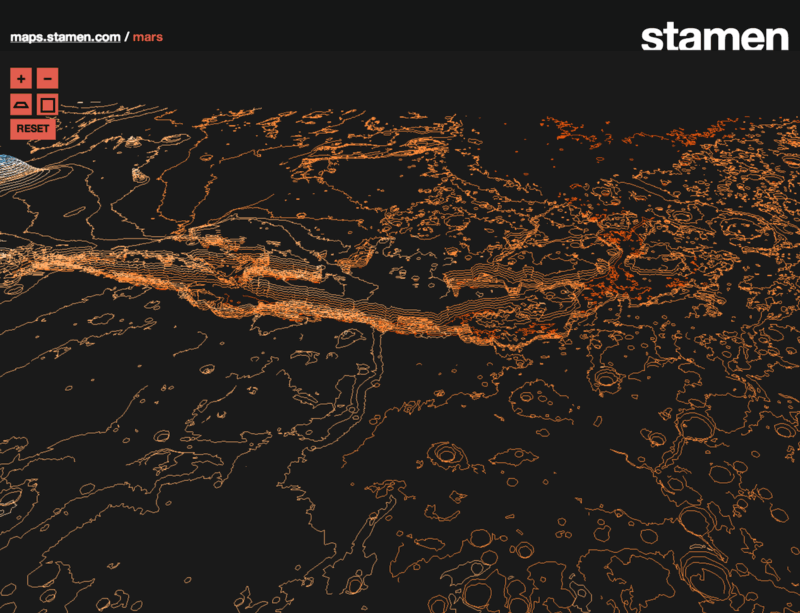
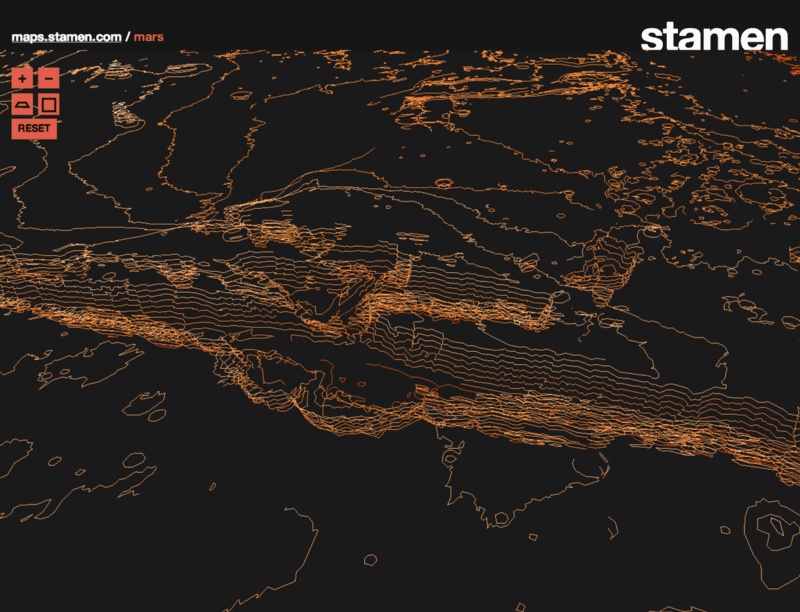
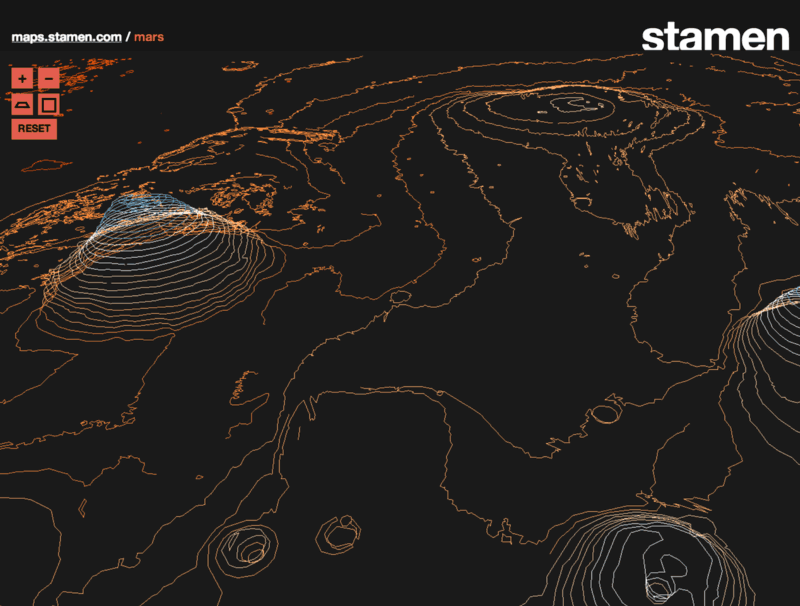
Mars!
