
Quantitative data can help us understand what is going on in the world in a way that cuts through human error, bias, and injustice…right? Wrong.
Heather Krause is a trained mathematical statistician and data scientist who founded We All Count, which aims to align quantitative work with equity values. We had a fascinating discussion for the podcast that orbits around this myth of objectivity in data.
In our conversation, Heather shares the ways that quantitative data is embedded with assumptions, biases, subjectivity, and power imbalances. And thankfully, she also shares why we shouldn’t give up hope despite this uncomfortable reality.
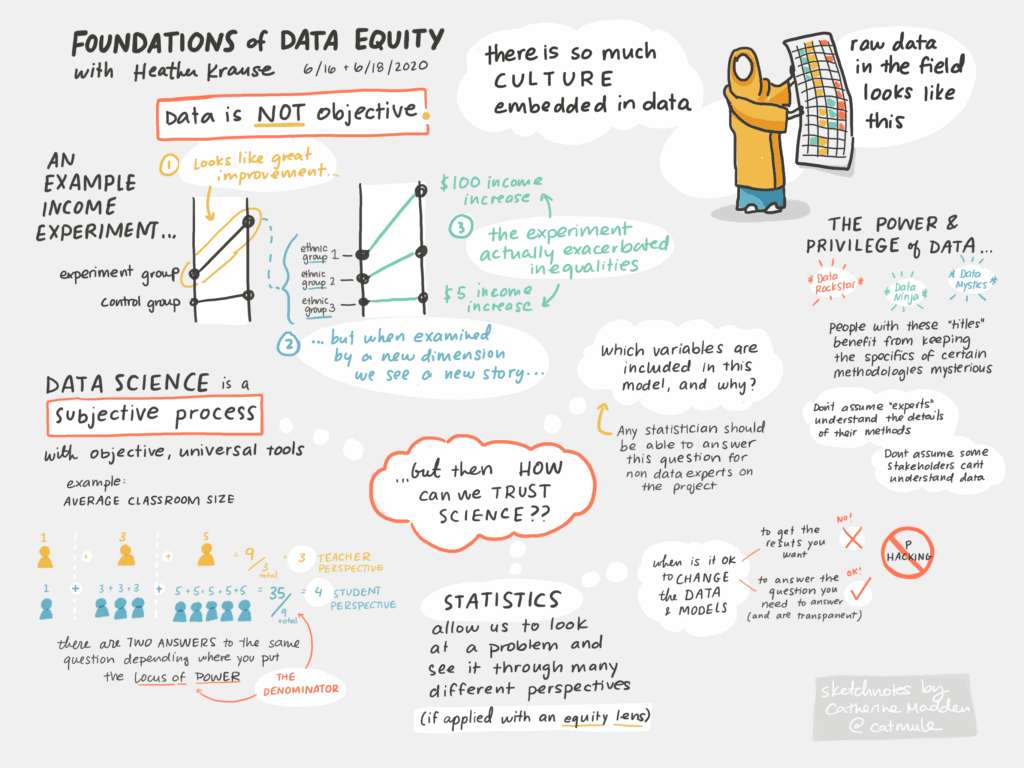
I came across Heather and her work a few years ago and immediately signed up for her Foundations of Data Equity workshop, and have been thinking about (and applying!) what I’ve learned every since. If you want to get a sense of what’s covered in the program, you can see what stuck with me from the sketch notes I created throughout the two half-day sessions.
One of my favorite moments in the conversation is when we connected around our shared experience of struggling to understand the concepts and course work and teachings of our fields (for Heather, the 4% grade on her first mathematical statistics midterm, and for me the failure to grasp even the most basic data structures concepts) and how breaking things down into the most elementary principles with plain language has served us well in the long term.
One thing I’m still holding onto in the weeks after our chat is the hope that Heather offers towards the end of our recording, where I start to doom spiral around the myth of objectivity. I asked her how she can still trust quantitative data, knowing that there is no such thing as unbiased data, (or an unbiased map). Heather pointed out that we can begin to trust data the same way that we trust people in our lives.
“The people in my life aren’t unbiased…but I have a lot of people I can trust because they are honest and open…and I trust quantitative data that is honest and open…if a piece of quantitative evidence is willing to describe to me the process that they use to produce that number, I will trust it even if I don’t want to amplify it.”
Heather Krause
At the end of our conversation I asked Heather to name a few individuals doing impactful work in this space that she’d like to see centered in these discussions. Keep in mind Heather made clear this list is a tiny fraction that deserve your attention– I highly recommend joining her weekly “Talking Data Equity” zoom calls to hear from more.
Do you have any thoughts on data equity? Or examples of when you’ve used equitable data practices? Tell us on Twitter! And if you enjoyed the episode, please help us share it!
Transcript — +
[music] You’re listening to Pollinate, a podcast on data, design, and the people that bring them to life. Brought to you by Stamen Design.
Catherine Madden (CM): Why we should stop using the term data science, the myth of objectivity and data, and finding hope and the uncomfortable truth that all data is biased. These are some of the juicy topics that we cover in today’s conversation. I’m Catherine Madden, a friend of Stamen, information designer, story strategist, and facilitator. In this episode, you’ll hear me learn about the hidden power structures that shaped the world of data science and how those of us working in related fields can acknowledge this reality to practice centering equity in our processes. Please welcome my guest.
Heather Krause (HK): Hi, I’m Heather Krause, and I am the founder of a project called We All Count. And We All Count is about equity in all things data.
CM: Oh, hello, Heather. Welcome. Thanks for being here. And I am so excited to talk to you about equity and data and the intersection of the two. This morning, I joined one of your talking data equity weekly calls and how did you describe it? You said aligning quantitative with the equity work.
HK: Yes.
CM: Yeah, I think that’s a great way to say and that’s the first time I’ve heard you say it that way. But first, before we talk about what exactly that means, I’d love to hear you talk about what brought you to this work and your journey to today.
HK: Yeah, absolutely. Well, thank you for having me. I’m very excited to get an opportunity to talk with you and absolutely so. I don’t know how far back you want to go, but essentially I got a lot of education around how to use data and how to use computers. I’m a mathematical statistician and a data scientist. And what inspired me to get all that education was my belief at the time that data was objective and that we could use quantitative data and quantitative evidence to understand what was going on in the world in a way that cuts through human error and human bias and injustice. So after investing a long time in learning how to use data to do that, I kind of popped out of graduate school and started to use data in the real world and realized almost immediately that the idea that data is objective and the numbers value-neutral is nothing but a myth. And the place that taught me that, first and foremost, was when I went to live and work in rural Bangladesh, which is what I did immediately after grad school. And it really was that project that changed the way that I view quantitative evidence.
HK: I worked on a project to help women who own cows use data, among other things, to find ways to get more milk from those cows. And I worked on that project for about six months before I went to Bangladesh. Right now, I live in Toronto, and I was living in Toronto at the time. And so I worked on that project in Toronto then went to Bangladesh. And after about two days in Bangladesh said, “Oh you’re going to have to throw away all the [inaudible] I did for you in the first six months of this project because I have now realized that I was embedding all kinds of assumptions into every single thing I did with data that don’t hold in rural Bangladesh,” even basic assumptions about what cows are like and what cows need to eat and much more obviously subjective things like what the definition of success is and all of that. And so that really, I think, was the moment that set me on this path of trying to not give up using quantitative data to understand the world, but give up trying to achieve this mythological, value-neutral piece of quantitative evidence.
CM: I was hoping you’d bring up that story. I’ve heard it in one of your workshops before. And one of the aha moments I had, I think you’re describing sort of the cost of their participation. The people you were gathering data from, it was hampering their ability to actually make a living for themselves. Can you talk a little bit about that?
HK: Yeah. Sure. And this isn’t a unique situation at all for any one particular project. But a lot of projects, certainly in the international development sector, collect data to satisfy the needs of funders and donors, and big fancy organizations in the global north. And the amount of time that the people, in this case, very poor brown women were spending providing data greatly interfered with what they were trying to do on a day-to-day basis. And that, thank you for bringing up that example, also kind of made me realize that the levels at which we were accruing value, the value I was accruing through this data collection process was wildly out of sync with the data that they were accruing.
CM: Yeah. A bit of an unequal exchange. And I think we’ll get more into that as we start to break down what exactly data equity means. But there’s something else I heard, I wrote it down in my notes as the burn it all down moment. And I don’t know if I made that up or it was words from you, but I feel like you were giving a talk to folks in the monitoring and evaluation space. So number one, I would love for you to define what that is for folks who are not steeped in the M&E industry. But then a little bit about that talk that you gave and what happened from there.
HK: Yeah. So the monitoring and evaluation world is a very funny world. It’s a world that is designed to understand what things work and sometimes understand how they work and sometimes understand what’s the return on investment and things like that. I was working in the monitoring and evaluation world for several years before I even knew the names of the monitoring and evaluation world. It’s a very strange place. But it’s a very important place because a lot of the decisions and a lot of the budgets and a lot of the resources that get deployed in terms of what happens in your child’s school or what happens in terms of investments in international aid, what happens in terms of investment funds, these decisions are often based on evidence that gets generated in the monitoring and evaluation sector. And the monitoring and evaluation sector is not a monolith like any sectors. There are fantastic pockets of this sector and there are super problematic pockets of this sector. And so the burn it all down moment came after– this was a couple of years after my experiences in Bangladesh. And I continued to work as a consultant in the monitoring and evaluation world. I’m a statistician, so I was doing statistical analysis. A lot of it was on impact, trying to find out if something was working or not. And I was just growing increasingly frustrated and angry with the power imbalances around so much having to do with measuring impact and who got to define success and who was taken into account in terms of does this work, who got to define does this work. And it seemed like if we really looked carefully at the power dynamics and the flow of resources. Most of them were actually opposite of the language that surrounded them. And I tried to make some changes from the inside. I wasn’t successful at it. I think some people might have been more successful than I was. And so essentially I just decided I’m out of here. I have data science skills, I’m fortunate enough to be able to take them somewhere else. And even if I have to work in the banking world, they’re not pretending in the banking world that they’re helping anybody. They’re just trying to make dollars. And I thought I’m going to just choose congruency over what I was experiencing as really deep-seated incongruency. And so yeah, at that point I had kind of progressed in my career enough that I was getting invited to speak at conferences. And I decided, well, since this is the last conference I will ever be at, I’m just going to give this 60-minute talk. It says everything that I think about these power dynamic problems around the way that we use quantitative data. So I’m not talking about power dynamics in many other areas which are equally problematic, but my area of expertise is quantitative data. And so I’m going to talk about the ways that we are using math to perpetuate the status quo and to double down on racism and colonialism, etc. And I thought this is my burning– I called it my Burning Bridges tour. And what happened was the exact opposite of what I was expecting to happen, which was a large number of people reached out to me and said. “Thank you for putting words and stories to what I’ve been feeling for a very long time.” And that’s what helped me realize that what I was saying was what a lot of people were already experiencing. But because I was a mathematician, I was able to kind of put formulas and mathematical equations into the stories that because of the problematic power dynamics that existed, broke through in a different way. So it was almost like arbitrage that it happened. And so that was when I decided, “Okay, I’ll stick around for a little while longer and I’ll give the speech a couple more times.” And then that was how We All Count got born, which was a project that is devoted to building very practical tools and very concrete stories about noticing the ways that we do make prejudiced choices with math and with quantitative data and equipping people to make different choices when they want to.
CM: Obviously, you are onto something and you picked up on a discomfort that a lot of people were feeling. But I’m curious what made you the one to finally say the thing? I feel like so often once one person points out the elephant in the room or declares something’s not working here, then it invites everyone else to join in. But that takes a lot of bravery and courage and perhaps privilege that I’m curious if you thought about what conditions were there that made you feel like now or never? And I know you talked about saying you can just take your skills and move them elsewhere, but was there more to it?
HK: Yeah. Well, first of all, I’m certainly not the one. There are lots of other people, both before me and at the same time as me, that have said these things and have built tools. So I certainly am not the one. I do think that what enabled me to make this choice is absolutely privileged, and I’m very aware of that because of a whole series of privileges. I have a degree in mathematical statistics, and that means that I am employable in sectors where even– and I thought about this very consciously, like, even if the entire monitoring evaluation sector hated me and put it on their Twitter and put it on their blogs and stuff, the banking system doesn’t care. And so I could go get a job in the banking system. So really how brave it was needs to be looked at with a grain of salt because I really don’t want to say it was very brave because I don’t think it was for me personally. I think other people are making much more brave conditions. Though I will say that one of the things that I think was different in my situation than in some situations is that – this is probably a very bad thing to say professionally, but – in terms of the statistical world, in terms of the mathematical statisticians, I am not the best. [laughter] I am not the best in that world. And because I’m not the best in that world, I’ve had to really struggle to truly wrap my hands around some of the theories and some of the maths. And because I’ve had to struggle with that so hard for so many years, I can talk about it in plain language because I couldn’t just talk about it in the super theory. I’m also married to a mathematical statistician, and he can get with his friends and talk at great length about some of these things in a way that most people cannot understand, myself included. [laughter] And because I’m not that good at theoretical statistics, I had to learn how to talk about it in a way that was both rigorous and scientific, but much more plain-spoken. And I do think that all of those sad, sad nights of trying to learn how to do that, getting a 4% on my first midterm in mathematical statistics, served me well in the long term. [laughter]
CM: You are totally bringing me back to my days and struggling through a computer science minor, and I would sit in my professor’s office, remember this so clearly, in the Data Structures and Algorithms course, where he was like, “Okay, we’re going to talk stacks. Think about cafeteria trays. The last person who puts their tray on the stack is also the first tray that will be picked up by the next person.” And I was like, now I get it. The other jargon, it just flew over my head. So I think there’s a superpower in that. And perhaps that’s why we’re both in adjacent fields of communicating complexity in a way that is more relatable to a broader range of people.
HK: Yeah, and I think that’s still one of the places that I can feel angry quite quickly, is that I think the fact that most statistics in computer science isn’t taught that way is one of the ways that we reproduce bad trends and privilege because there’s no good reason that we can’t teach statistics in a way that is useful and meaningful to the general population. The fact that when I do it, my mailbox and my chat fills with people that say, “Why didn’t my grad school professors say it in this way?” And I’m like it’s because there’s a tremendous amount of power right now in being a data scientist. And so who gets to be a data scientist is very carefully policed.
CM: Not only is there sort of a filtering mechanism that you have to check a certain range of boxes in order to even enter this field. But then once you’re a practicing data scientist, there is this sort of expert role that comes with mystique and privilege that I feel like people just sort of either are like. “This person must know better than I,” or they’re afraid of looking stupid and asking you for it to be explained in different terms. And that’s dangerous.
HK: That’s dangerous, and that’s on purpose. And one of the first things that we [inaudible] started doing was holding weekly things that we called at that time data amnesty because that was one of the things that made me so angry was this bullying language that one of the ways that the data elite protect their status is they say things in the most confusing way possible and the hardest way possible to understand. And so anybody who disagrees with them has no hope at winning that argument because they can’t understand the counterargument. And the other thing is there’s a lot of emphasis, which I’m in support of, of getting more diverse populations and communities educated in statistics and data. And I’m in favor of that, but that’s not going to solve the problem. And I really learned that when I went to teach statistics in Ghana to people who had been very highly educated in the United States. And I realized that what had happened was– because I thought, “Oh, excellent. I’ll get to learn how other cultures do data science.” And what I realized was, oh, no, we’re exporting this because we have this big myth of data science is an objective, value-neutral process, and so as long as we teach everybody to do this, they can take this back and apply it in their setting when a lot of the decisions and a lot of the formulaic recipes for statistical analysis that the people I was working with in Ghana were using were very inappropriate for their context. But nobody had ever said or noticed that you don’t have to do this to create rigorous science. About half of what we think we have to do to create rigorous, robust evidence actually consists of the elements and the procedures that we actually do need to do to produce rigorous, robust science. And the other half is somebody’s opinion and somebody’s habit and not necessary. And so until we start distinguishing which elements are necessary for rigorous, robust science and which elements are just somebody from the 1800s or whatever [inaudible] their personal preference that we have just been replicating for centuries.
CM: Yeah, I guess I’m just thinking. And this sort of leads me to my next line of questioning, which is breaking down data equity, what the terms like data science even mean. Because is data science just math and statistics? Can you describe data science to me in a way using your superpower of plain language?
HK: Well, no, I can’t. And it’s probably a word we honestly should stop using. I’m not sure it’s a helpful or useful word. I’m not sure it hasn’t lost all of its descriptive abilities. I think it’s much– I mean, and again, if you google what is data science, you will get many opinions that it’s some kind of combination of statistics and computer science and their stacks and stuff like that. But what I’m actually focused on is anyone who’s using numbers to make meaning and if that person calls themselves a data scientist or if that person calls themselves an analyst. I mean, and here’s the thing. When you get right down to who is making the most important decisions based on numbers that are going to affect lives, it is almost never someone who calls themselves a data scientist. It is almost always someone else that has a different type of job title.
CM: Yeah. And so then that person is interpreting the work and the perhaps communication of the quantitative results, or what would you say is informing those people?
HK: Yeah, I mean, that’s what I would– there’s a whole evidence generation process. And the person who is framing the question and the person who is passing legislation about what categories data has to be collected in, I mean, those people are almost never data scientists. And the person who is deciding which result they’re going to use, which number that comes out of this research is the one that they’re actually going to use is almost never a data scientist. And then certainly the person who’s creating the policy brief or the research brief or the business intelligence brief, whatever sector you’re in, is also not usually a data scientist. So I don’t think we need to worry too much about what data science is.
CM: Okay, I like that. And it’s a little bit freeing for me because it has been just elusive to describe. And I’m with you on the initiative to consider a new nomenclature. Speaking of nomenclature, I’m curious how you define the word equity.
HK: That’s an excellent question. And the important thing in terms of we all count is what matters here isn’t my definition of equity because what I don’t want is to reproduce this thing where I say a definition of equity and then a lot of people working in data try and align their data decisions with my idea of equity. My idea of equity does not matter. What matters is the definition of equity and the concepts of equity that a project or a piece of research is either saying or working to align with. And that ranges from the intentional inclusion of everyone in a society to measuring how race is related to accessing a resource or to get changes in income inequality in a community before and after a project.
CM: Again, I love this sort of like “you can’t make me define it.” Well, it’s really, really helpful because it is so true. It depends on the context. And a question that I was thinking of as you were describing this is– or something just to clarify is a lot of the initiatives that you’re supporting with We All Count are organizations that are endeavoring to build equity in some way or another. Is that right?
HK: Well, not always. I mean, for sure, a lot of them are. But even if you’re not focused on equity– this is the part that’s really important. Even if you are working with a team that is trying to get a very accurate, precise, useful number out of a mathematical model and even if that number has nothing to do with equity, if you want that number to be accurate and usable, you have to pay attention to whose point of view and what value systems are getting embedded in the production of that number or that number is going to be inaccurate and not usable and a bad investment. The people that tend to say, “Yes, we want to definitely make sure that our quantitative work aligns with our equity goals,” are absolutely projects that are trying to close gaps or trying to reduce racism or trying to reduce colonialism. But equally important are any quantitative project that is trying to use data about people and produce a number that is worth the money you spent to get that number.
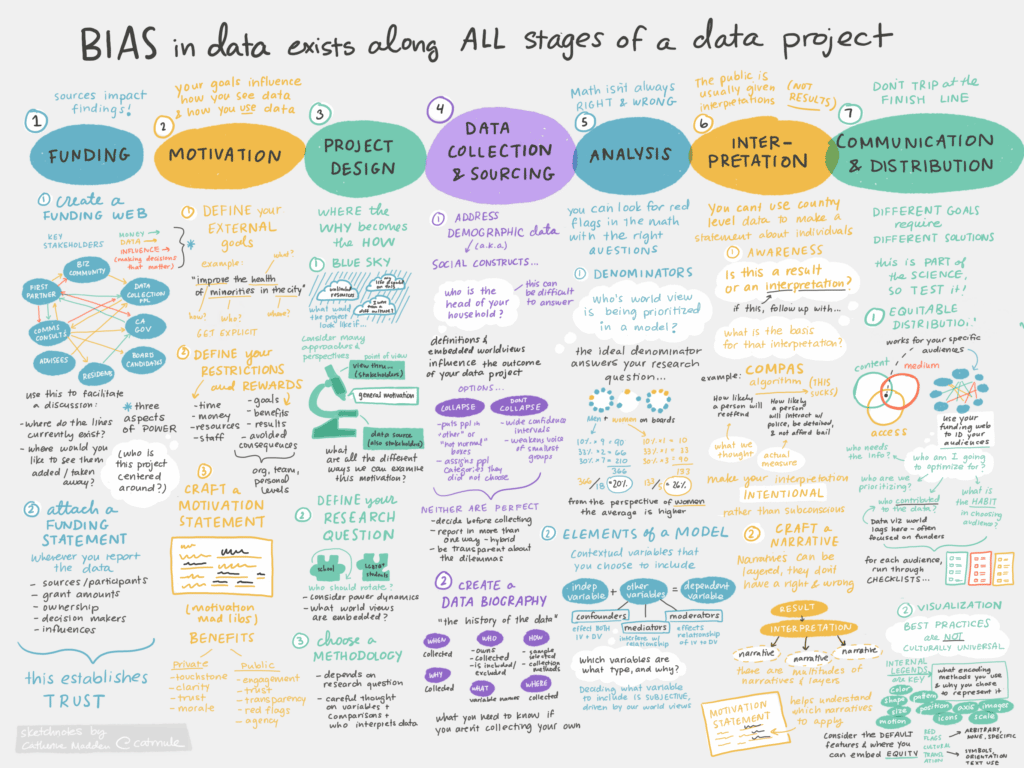
CM: Yeah, I’m glad that was your answer because I can imagine a lot of people hearing this and being like, “Well, I’m not working in an equity mission-centered organization. Does this even apply to me?” and it’s like, “Well, yeah.” I’ve been thinking about this for a while. I think data is people. And I don’t know of many data sets that you can’t ultimately link back to people. But particularly for those that are really influential in informing new policies that affect people’s lives or bias in algorithms that are being sold to police, it’s crucially important. And it’s not a niche industry. It feels like it’s a universally important and individually responsible or I just feel like I would love for everyone to take foundations of data equity. And it’s also not just about the people doing the data science. And so I think that’s one thing I really loved about the framing that you provide because as someone who really focuses on the end of your spectrum, which goes all the way from funding to motivation to designing how you’re going to collect and analyze data, all the way to how you’re going to communicate it. I work exclusively on the communication end, but understanding that there are things that I can do within that vertical and things that I should be aware of that are happening before the data reaches me to begin doing the communication piece, I feel like is really helpful for me understanding that there is a role I can play and there are questions that I can ask that are influential to the people who are sort of upstream for me.
HK: Yeah, absolutely. I’m really happy to hear you say that. And I think really in terms of ensuring that our results mean what we think they mean, and that’s the important bit. I’ve said that two or three times now in this podcast. Bottom line question is, is this number accurate, and does this number mean what we think this means? And that’s an important question, whether you are deciding whether to use a number that tells you whether or not you should use sunscreen to a number that tells you where you should put your child into school, or a number that tells you what the disparate impact of a policy is. And if we could really focus on that consumer side. You’re talking about the communication side. The data storytelling side. The leaders who do make decisions. If the communicators and the storytellers and the decision makers would refuse to make decisions or tell stories with a data point unless they could see a very, very transparent provenance of, “What are all the decisions that produced this number said to me in a transparent plain spoken human way?” That is what would move the needle on kind of the rockstar profession of the analysts.
CM: That brings to mind a story. In my personal experience, someone wanted my help with some data storytelling. And after the first initial call, I was like, “Great. This is all about protecting natural lands in the United States.” And after a little bit of digging on my part, I realized that the sponsors of this project were in favor of cutting down more forest. And I asked a bunch of questions like, “Where is this data coming from? Who is paying for it? What is their motivation?” And the intermediary, the folks that were kind of trying to staff up this project didn’t have the answers for me that were at all sufficient. And it was a clear no. I’m like, “If you can’t explain the potential forces that are pushing their agenda through this project, I’m not comfortable helping them do that.”
HK: Yeah, good for you for asking those questions and being a shining star in your profession because that really would move the needle for rigorous better data. And that reminds me of something that I do get asked a lot because what we focus on, we all count, is the way that a world view or a lived experience gets embedded in a piece of data is a direct result of the series of choices that get made in the evidence generation process. And that’s true if you’re doing an impact analysis in rural Bangladesh. That’s true if you’re doing a continuous improvement project in the education sector. It’s true if you’re just counting up the number of people that showed up for your local nonprofit event. It’s true if you’re making a map. And those choices all embed values, and it’s unavoidable. It’s not like, “Oh, we’re going to generate something with no choices, a choice-free view from nowhere, piece of data.” It doesn’t exist and the fact that so many people are willing to kind of pretend those choices don’t happen or pretend that they don’t have a choice– so many people will say, “Well, I have a job, and the such and such, an authority, tells me that I have to collect data in these categories. I know the categories are very harmful to certain people.” If you are going to choose to be in a job that is as powerful and influential as any job that’s working with data right now, then you need to decide where your line is. You do have a choice. We just actually published a piece on this the other day because I was so angry.
CM: I loved it. I read it and share, share, share.
HK: I was very, very angry, and it was like, don’t tell me you don’t have a choice. And there’s lots and lots of– there’s a whole continuum of choices. I don’t mean every time you need to stand up and quit your job and walk out, although at some point you do, as a data person, need to know where that line is, but there are lots of other things on the continuum. [laughter]
CM: Yeah. It’s not that you don’t have a choice. You just don’t like the consequence of making that choice.
HK: Right. Yeah, I mean, you’d like to remain in a position of privilege, frankly.
CM: Right. And, I mean, I guess there are some people who are like, “Well, if I leave, then they maybe will hire someone who’s not even going to question things,” and maybe that’s true, but–
HK: Well, that’s a whole different podcast. That’s a podcast on ethics. [laughter] I mean, that’s an important conversation that you need to have with yourself. I mean, I don’t mean you need to have with yourself, but each of us need to have that conversation with ourselves. I mean, this is a map organization podcast. Would you allow somebody to hand you a map that you had no idea about whose world view this map was of and tell you to follow these directions or put your child somewhere on this path on this map? Would you just do it, or would you be like, where did this map come from, and what’s at the end of this map, and who thinks that this map reflects reality? You would ask those questions.
CM: Indeed. Eric, the founder of Stamen, in his interview said something like, every map is sort of a declaration of power in some way, and whether it’s just state boundaries versus native lands and how we’ve just subsumed certain cultures. It’s just like a revelation for many people when they actually stop and think about it. It’s like, oh, it hasn’t always been this way and someone decided that this is where these lines go and–
HK: Yeah, there’s no such thing as an objective, unbiased map. Just like there’s no such thing as an objective piece of quantitative evidence, and that’s okay. We need to calm down about that and become comfortable with that and realize that that opens us up to being much, much better and getting much more value out of maps and quantitative data.
CM: Yeah, I think something that gave me a lot of hope in the foundations workshop is that there are tools at hand that demystify some of the decisions and processes and folks behind every project. One example is the motivation statement, the funding web, tools that you’ve developed that really serve to empower the folks that are the end consumers of it, because they can go in and see like, oh, this is the motivation of the people behind this project, and these are the sources that provided the money for it. I’m curious if you’ve seen any of those tools in action, because I’m thinking about– even just some Stamen projects, wondering if there’s room to add that into the project somewhere. What ways have you seen this work really well?
HK: Yeah. Any step that you can take to practically and transparently communicate to somebody who’s supposed to make a decision or gain information from a number or a map is a step towards equity. And we’re working with a couple of clients right now who do make interactive maps about different measures of health across the United States. I won’t go into detail about exactly what because of the confidentiality agreements, but they are doing things like adding a tab that shows something akin to a funding web. And if a funding website is a new concept to you, basically a funding web is an incredibly simple and concrete diagram that shows where money and data and decisions are flowing through your project. And just showing a little diagram like that attached to the outcome is so much more effective than pages and pages of the paragraphs that people put on their research to say exactly who they’re getting paid by and whether they have conflict of interest.
CM: Yeah. The facilitator in me also loves this concept of a funding web as an activity to generate in the early stages of a data project a really important dialogue about money, data influence. Because if you are, as a data collector going into a community and extracting data, what are those people in the community getting from the project? Or are you providing money to them in exchange for their data? And I just love the idea of collectively mapping this out. I imagine being in a room and helping people draw lines and then identify. So I’m glad you put some thought into this and have a tool now for people to anchor on.
HK: Thank you. Yeah. And again, even if your project doesn’t care about equity, even if you have every intention to be extractive, even if you’re trying to be extractive, making a diagram of how it’s working is a really good congruency check. It allows you to cut through a lot of the words that can be very performative and check what does the infrastructure of this project really look like in just a couple of lines in three colors. Let’s just cut through– The bullshit. I don’t know if we can say that on this podcast, but–
CM: I hope so. [laughter]
HK: Let’s just say that we can cut through the bullshit and boil down to what is actually going on and is that the infrastructure that’s going to produce useable rigorous, meaningful results?
CM: I hope that this conversation might get into the ears of folks that are involved in the design of these projects and can think about either reallocating budget to those later parts of the project and thinking about communication research in terms of what are the audiences that you’re not thinking but would be helpful to reach just in terms of public perception or whatever else you’re interested in tangentially. So I would love to see more of that.
HK: Yeah, I agree. Very strongly agree. And in addition to maybe rethinking budget allocation, even if the budget has to stay the same, I would rethink time allocation. I mean, I’ve been doing this for a long time, and the projects that I have seen end in heartbreak, often expensive heartbreak, are the projects that get to the end and realize that the data story that they need to tell or the question that they need to answer, they have completely misdesigned the project and they’re answering a different question. And so if you got a communication professional involved earlier, at least for a little bit of time, and almost talk about, okay, what are we going to say at the end? And how are we going to say that? And then design a really rigorous scientific process that can allow you to have the actual answers that you need in the end and communicate those answers to the people who need them, I think you can actually keep the budget the same and just reallocate the time.
CM: I love that suggestion. Yeah. And involving the people who are at the end, at the beginning in different ways. I’ve been on a mission to bring designers and communication professionals, in particular, way earlier into projects of all kinds because it helps you grasp the topic, it helps you influence some of the direction in a way that ultimately serves the final product.
HK: Yeah. And when you use that word influence, I think you’ve hit upon the reason that some of the more conventional science teams are hesitant to do that because they don’t think the science should be influenced by communication people, because that’s going to take away the objectivity. And so that myth of objectivity is how we are stuck in a loop of bad science because we’re achieving something that is unachievable and all the solutions that are going to help us get better science interfere with the myth.
CM: Is the quote, “myth of objectivity” a term that you heard elsewhere, or is it something you started putting out in the world?
HK: I don’t know. I can’t imagine that I am the first person to say it. It’s been part of my life for so many years that I don’t know where it came from.
CM: I heard it from you first and I am grateful for it because it is a great way to summarize how much bias is embedded in all of it. And I guess on that topic, I’m just curious, how do you come to trust quantitative projects or data science in general, knowing how much bias is embedded in the process?
HK: Great question. Really good question. I’m glad you asked it because a lot of people say, “Well, why don’t you just leave the quantitative world?” And it’s because I love the quantitative world. And I don’t believe that the fact that the quantitative world is biased means it’s less trustworthy. How do I ever trust a piece of science? It’s the same question of how do you trust the people in your life? People in my life aren’t unbiased either. But I have lots of people in my life that I trust because they’re honest and open, and I trust quantitative data that’s also honest and open. And by open, I don’t mean you have to show me the conventional kind of open data where the data points are posted on a website or something. But if a piece of quantitative evidence is willing to describe to me the process that they used to produce that number, I will trust it even if I don’t want to amplify it. Even if I think, “Oh, this number is an accurate scientific number that centers a value system that isn’t appropriate for the project I’m working on. That doesn’t mean I don’t trust that number.
CM: I think this leads us into my third chapter, if you will, and final chapter of our conversation, which is all around hope. I think, like you, I went into the world of visualizing data and data storytelling because I just believed in it. And it felt like in a world where things are complicated and I don’t know how to decide to go down this path or the other or whatever, it’s just helpful to have numbers. But then I just learned so much more about how they’re generated that. It made me feel like I have a talk about this where I, in three minutes, sort of describe my relationship to data as a love affair. And at first, we’re hot and heavy and we’re ignoring all the rest of the world, and then I feel betrayed by it at some point. And now we’re working on restoring our connection and relationship because I do want to come back into a place of mutual respect. With that story as the seed, I’m just curious if you’ve got things or examples or stories that you can share with me that have left you feeling really encouraged of this open and honest use of data that you would want to amplify and that you feel like data is not the enemy [laughter].
HK: That is such a good story because I think about data as a relationship a lot and we have tools that help you kind of analyze what is your data relationship and what kind of data relationship are you creating with the people you’re collecting data from. But I hadn’t thought of it as the concept of data in a romance, because now I’m kind of thinking about mine yeah, I guess I tried to break up with data and they reeled me back in. [laughter]
CM: Same.
HK: I feel a tremendous amount of hope around quantitative data, and I think the amount of hope that I feel comes from a couple of different directions. The first is that there’s this whole group of people who are in decision-making positions in the public sector, in the corporate sector, in the philanthropic sector, who have an uneasy feeling about data but are so hooked in to the kind of data industrial complex of objectivity that they don’t like data and they’re unhappy. And then what I have found is it only takes a very small amount of time and a couple of really good examples before this group of people suddenly realizes how much progress they could make with a really well-done piece of quantitative evidence, how deeply and effectively you can understand what’s driving disparate outcomes and what people are actually experiencing if you generate quantitative evidence differently.
HK: And it takes such a small [laughter] amount of stories to just light these people up and have them going back to these big organizations, whether it’s these big tech companies, fancy academic institutions, departments of the government, and being able to use these stories and say, “We’re doing things differently.” That gives me tons of hope because it’s not nearly the uphill battle that in my mind I had built it up to be. There are many more people that want to use data to deeply understand the correct lived experiences or what’s actually going on. And quantitative evidence can do that. That’s the thing that people get confused about. “Well, if it’s not objective, then it’s not a good descriptor of what’s going on.” No, not at all. It’s actually a better descriptor of what’s going on, because which one of you humans is experiencing life from an objective point of view? Exactly zero. [laughter] And so actually, data is better than we think. The idea, the loss of the myth of objectivity doesn’t mean that data [laughter] is worse. It actually means data is so much better.
CM: Okay. Yeah, you’re kind of winning me back here, but [laughter] I’m glad that you feel hope. And I’m going to bring us home here with a few questions just centered around the folks that are listening to this and wondering if they’re vibing with this conversation. Where would you point them to in terms of not only work that we all count as doing but other voices in this space, particularly Black, indigenous, or people of color since we are two White women talking about equity? I know you do a really good job of talking data equity, bringing in diverse voices, but where would you send people?
HK: Yeah. And that is why I am very careful to really pretty much not define equity because it’s not my place, right? It’s my place to try to cut through hypocrisy and incongruence and try and be part of the group that created the problem, that’s working on fixing the problem. But it’s not my place to say, “This is what success looks like.” The number of people that I could direct you to is very high, and it really depends on what sector you are wanting to know about. So for example, the Urban Institute, Sheena Ashley, is amazing. I’m not sure right now what her title is, but I think she’s in charge of their racial equity lab, and she is absolutely fantastic, one of the coolest, smartest people I know working in quantitative data and equity.
HK: Also in the DC area, there’s a person named Brittany Rabb who does research for the Department of Education in Washington, DC, also amazing, really deep thinker about how to use data to cut through performative equity and actually get to ground truth [laughter] equity. Also, big shout out. I know this is a map podcast, so everyone probably already knows about this, but the folks at Native Land Digital, I don’t think I ever give a presentation without mentioning them and showing their work here in Canada. I think really it was indigenous map making that gave birth to none of it, which I think it still remains the only place in Canada and the United States where indigenous people reclaimed self-governance, and that was entirely driven by indigenous mapmaking in Canada.
CM: Oh, wow.
HK: Yeah. So speaking of Native Land Digital, Abigail Echohawk, she is, I think, the director of Urban Indigenous Health in Seattle, and she has insights and teachings on the implications of quantitative work for First Nations and indigenous people that have really been the foundation of a lot of the work that we do and goes hand in hand with the work of Stephanie Russo [Carrol] at Arizona State, who runs an indigenous data governance shop. She’s developed so much research, so much best practices, and I try and take my lead from her as well. Those are a very small handful of many, many, many people.
CM: Thank you for sharing those names. And I would also love to point folks towards whatever you have going on in the future with We All Count, if there’s foundations of data equity coming up in a workshop form or additional conversations that you’re having.
HK: Yes, for sure. Thank you for that opportunity. And most Fridays– not every Friday, but most Fridays, from noon to 1:00 Toronto time, we do something called Talking Data Equity, which is very informal, free, kind of drop-in conversation about the practice of data equity, where we take live questions and answers and we have guests and things like that. So if you want to do something really informal, you can just hang out there.
CM: What a lovely conversation this has been, and I’m so grateful for you spending the time with me today. And I know a lot of people are going to listen to this and learn a lot and be empowered by what you’ve shared. So thank you so much.
HK: Well, thank you for having me. I don’t think I took enough of a chance to say what a long-term fan I have actually been of Stamen even before I had thought about data equity. And I was just working on getting my degrees and learning about people doing cool database. I was an admirer of the work at Stamen and it was very, very cool to be invited to come on to your podcast and have a conversation with you. I am very grateful for the opportunity.
[music]
Thank you for listening to Pollinate. Thanks to Heather for our conversation today. Music for Pollinate was created by Julian Russell. You can learn more about the great work Heather does with We All Count at weallcount.com. If you liked the show today, you can help us out by rating, reviewing, and subscribing. If you know someone who might be interested, please, share it with them. And if you have any thoughts about the episode, we’d love to hear about them. Tweet us at Stamen using the hashtag, #PLN8. For a summary and full transcript of today’s conversation, check out the blog post at stamen.com/blog.