
It’s time to start talking in public about the major revision to Bing Maps that Stamen designed for Microsoft.
It’s not every day you get asked to re-imagine the state of online mapping for a company that has the resources to actually take a shot at it, and in looking back over the project archive in preparation for this post, I’m basically overwhelmed by the size of the undertaking that Blaise Aguera y Arcas and his group asked us to participate in. It’s too big, and has become impossible for me to sum it up in any kind of cogent way — so I’m going to start by posting a few sample artifacts from along the way and see if that opens any floodgates.
Luckily, Justin O’Beirne has done an extremely detailed and comprehensive review of the design, right down to examining the similarities to old Rand McNally maps and hard-core analysis of micropolitan area placement. Another reason why it’s been so difficult to get this post out the door is because Justin’s done such an incredible job looking at all of the moving parts. But more on that later.
Cartography:
We designed a tileset for the maps that was intended to just…calm things down a bit. One of the things that it gets hard not to notice after a while is that 99% of the map tiles out there are hyper-colorful, with bright popping hues for freeways and on-ramps and all the rest of it. While this arguably makes for a clear map when you’re trying to drive somewhere, it makes designing a map of things on the map a bit of a challenge, since the map itself is competing visually for attention. So the first thing to do was to come up with a way of thinking about the map as a place to put things on, not a map that already had everything on it. We called it “mylar” because it minds me of how old architectural drawings look when you draw on the matte side of a sheet of plastic mylar paper: muted, subtle, and leaving lots of room for a foregrounding effect above it. There are a few examples below, and a more complete set of them here.
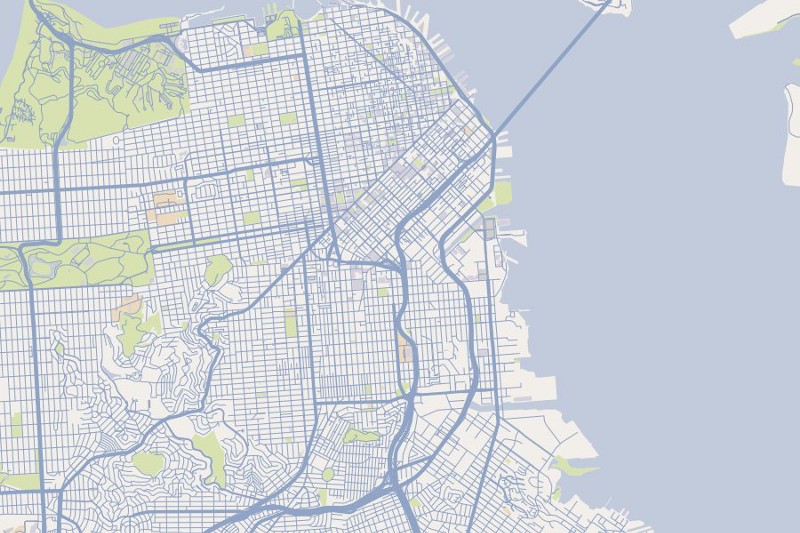
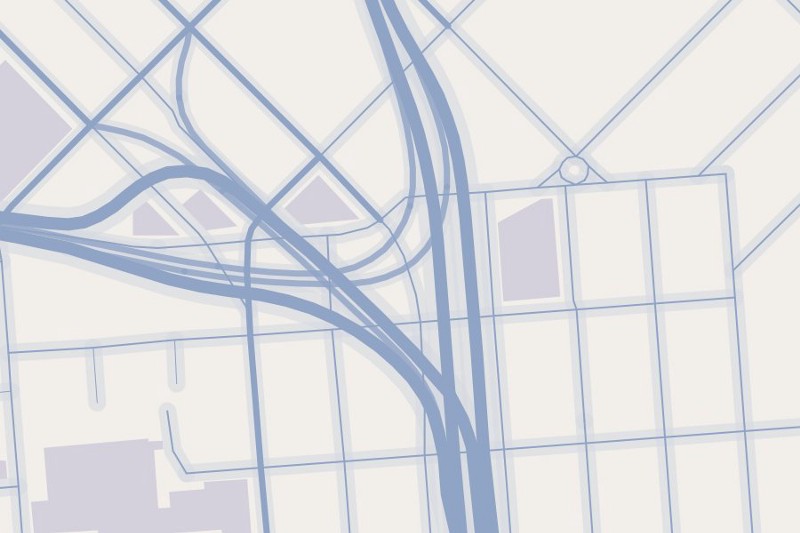
There’s no type in this set, except at the street level. The idea is that these are for use when the type is part of the presentation layer, as it is in this demo that we put together using this tileset underneath the California Stimulus Map that we did last year:
And here’s how it looks in the context of Crimespotting:
It’s about taking a deep breath, calming things down a bit, being considerate about the typography, and giving the map the room to serve as a canvas for things to play out on top of it.
We thought a lot about zooms and text
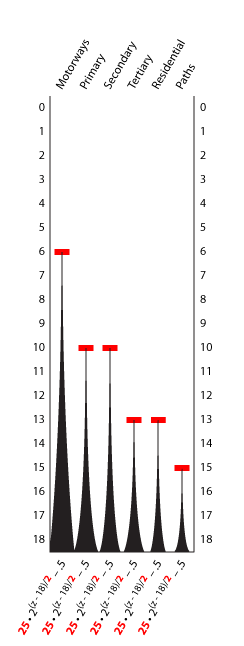
One of the major themes to think about in was the migration of alot of the content out of the tiles themselves and into an interactive framework. The idea was that you could, for example, click on a city and be zoomed in to it, something that I think the delivered project does pretty well. In order to make this happen we had to think alot about the relative sizing of type and roads at various zoom levels — and to rethink the whole notion of there being discreet zoom levels at all. We wound up with lots of diagrams like this to illustrate things like the drop off rates of the sizes of the different road types as you move in and out of the map:
We had the chance to really think about how much information you might want to see on the map at any time. Justin has detailed thoughts on ideal densities for cities, and I think there’s alot that we and Microsoft can do moving forward to improve the specific densities of areas like the Interstate 44 corridor in Missouri. The exciting part, for me, was to be able to think about the kinds of opportunities that open up if those kinds of decisions become dynamic. Like, what if there are always 50 labels on the map, regardless of what zoom level you’re at? What if there’s only one?
To this end we put together some demos that let you play with these numbers a bit. Be gentle on these if you would, they’re pretty much raw files straight out of a client work process without alot of thought given to the niceties of interface and user experience. But the thing to try is to to adjust the number of labels and the scale factor, and see if you can find an arrangement you like. Pretty soon I wind up with maps that look like this:
Which I think is just lovely. Another fun thing to do is to set the max # of labels to 1 and drag around. You wind up with a map that only shows the largest city in the viewing area, which is a nice way of thinking about a place: what’s most important here?
There’s alot more to say. I haven’t touched on breadcrumbs, or clicking on cities, or dynamic labeling. Next time. In any event: Bing maps!