
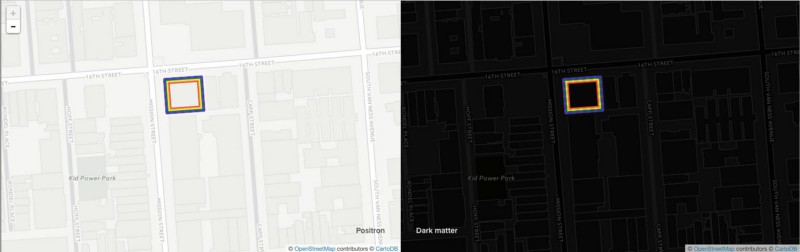
Ready to make lovely maps using open source data on an open source platform? Two new basemap styles — Positron and Dark Matter — are available from mapping platform CartoDB, waiting for you to make your own beautiful visualizations.
CartoDB already has a suite of styles to choose from, but some of the ones using OpenStreetMap data were only available at limited zoom levels. With our new styles, visualization possibilities await at all zooms, creating an opportunity for depth beyond what’s been possible before now.
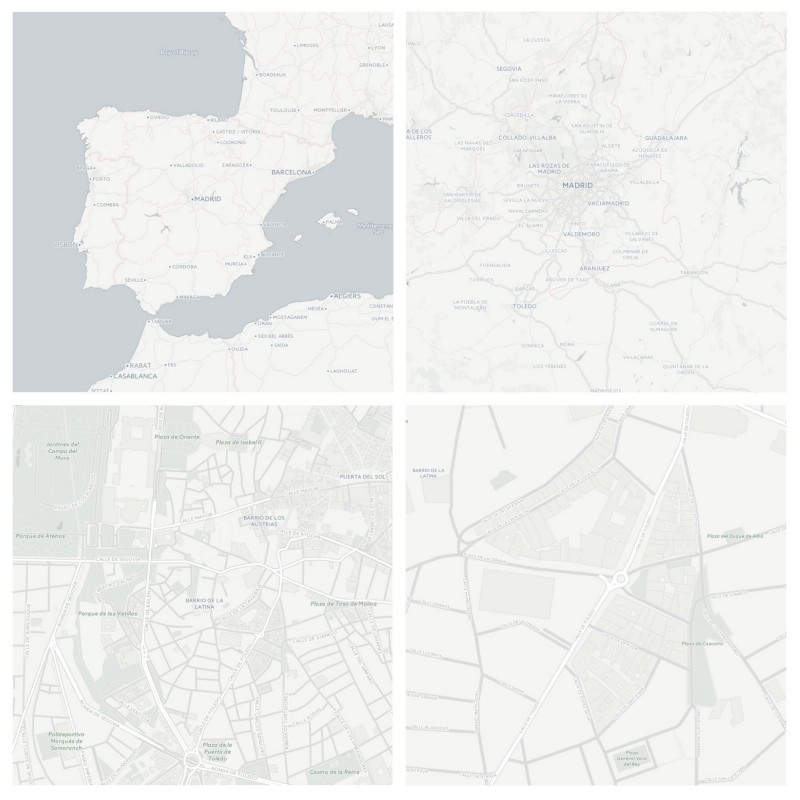
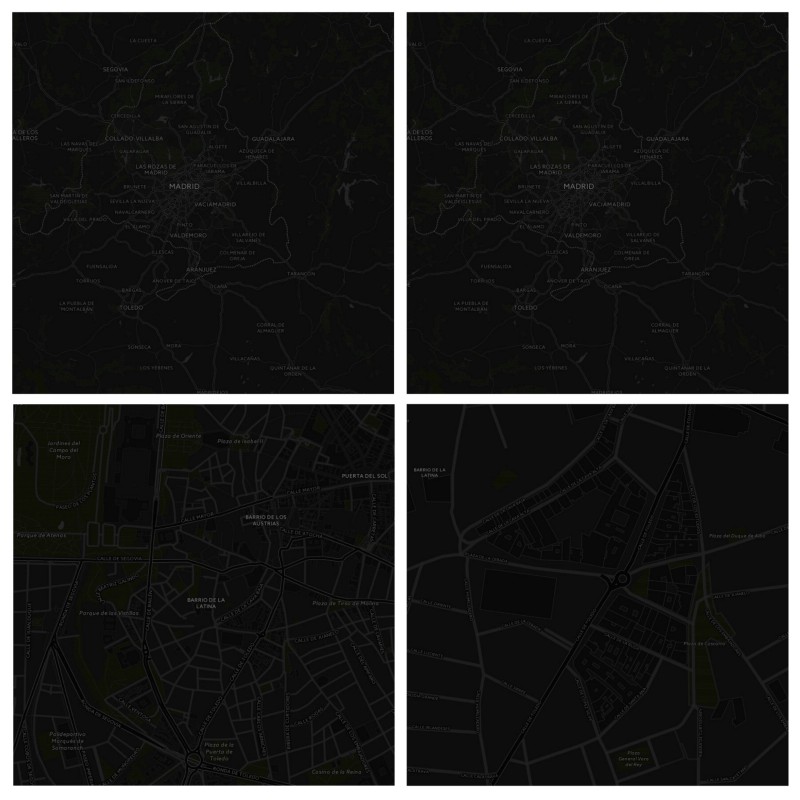
Throughout both maps we’ve made clear labeling for cities, parks, water bodies, and administrative boundaries. We’ve also worked out the relationships between line thickness and outlines for roads, railroads, rivers, and lakes across all zoom levels. Relative brightness of various features have been tweaked to create an appropriate hierarchy of importance at all zoom levels.
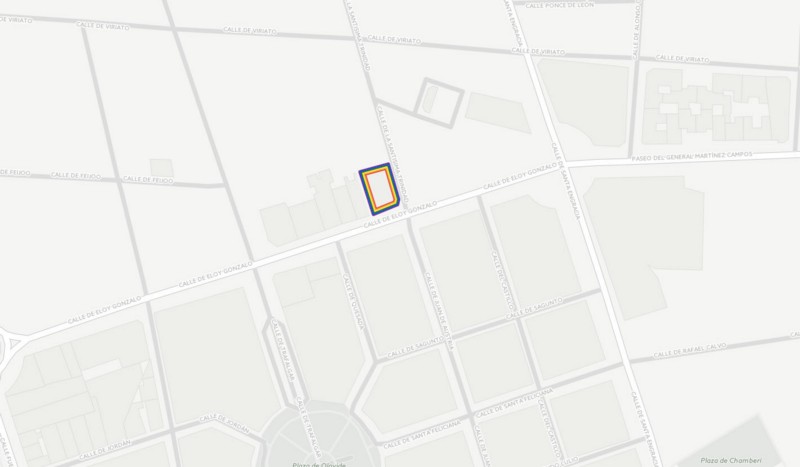
And finally, we’ve given some extra special love to the CartoDB offices in Madrid and Brooklyn, and the Stamen office in San Francisco (only visible when you zoom all the way in).
It’s been great working with CartoDB to make it easier for everyone to make data visualizations. Now we’re excited to see what you make with what we made together.
Want to use these basemaps with Leaflet.js? Here’s how:
var layer = L.tileLayer('http://{s}.basemaps.cartocdn.com/light_all/{z}/{x}/{y}.png',{
  attribution: '© OpenStreetMap contributors, © CartoDB'
});
var map = L.map('map', {
    scrollWheelZoom: false,
    center: [40.7127837, -74.0059413],
    zoom: 6
});
map.addLayer(layer);
Let your data story sing!