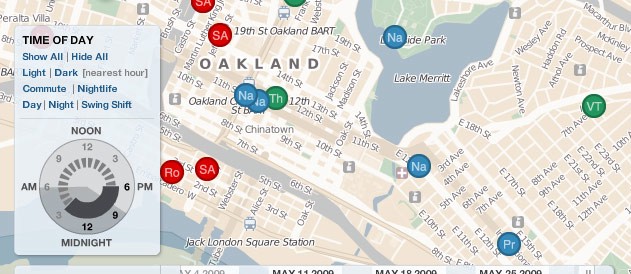
We’re happy to release two updates to the interactive map that address our most frequent feedback requests: you can now filter crime reports by time of day, and link to and view custom reports for the last two years of crime in Oakland.
Hours

The interface we’ve created to navigate through the hours of the day is something we’re calling the “time pie”, a small circle not unlike a pie chart, with the full 24 hour cycle around its perimeter. Noon is at the top, midnight is at the bottom, 6pm and 6am to the left and right. Hours of sunlight are shown as a slight shading in the background of the circle, and these update according to what day you’ve selected. The hours of the time pie can be individually switched on and off, and you can also click and drag it to enable or disable a range of hours. Any time span can be selected, and we’ve added a set of buttons that show a few time slices that we think are particularly meaningful:
- Hours of daylight and darkness based on local sunset and sunrise times
- Commute hours for the morning and evening
- Nightlife hours spanning happy hour to last call
- Three police shifts: day, night, and swing
We’re hoping these categories will broaden the project’s reach, and make it that much more useful to both the public and the police alike. The last time slices (day, night and swing) are the ways that the police view this information, and one thing we hope will come from the project is a better understanding of how the police view their data as it’s collected.
We think the time pie is better than anything else out there in the online crime mapping world- as far as we know, Crimespotting is the only site to offer a filter for specific hours of the day on an interactive map — please leave a comment below if you know different.
Days

We’ve also upgraded the the map’s date slider to include data all the way back to our summer 2007 launch. You can now page back and forth week by week using the two large arrows to the left and right of the date slider, and you will also find drop-down menus to quickly jump to a particular month and year in the past. Finally, there’s a button that will navigate to the most recent week of report information.
Years
The data for the new years-long timespan is something we’ve always kept, but we were reluctant to display it on the site because we lacked a good method for visually navigating it. With the introduction of these hour and day widgets, it now makes sense for us to open the entirety of our archives stretching back to the middle of 2007. This means that old URLs for static representations of crime reports are now newly available, as well as a complete catalog of all reports made available to us in the Police Department’s nightly spreadsheets.
Links
The long and the short of this new version is that it’s much easier to see and link to a broad range of times and dates. In particular, it’s now possible to navigate and link to recent newsworthy events like the assassination of journalist Chauncey Bailey, the Oscar Grant riots from January 2009, and the Lovelle Mixon incident from this past March. You can also retrieve data in spreadsheet form for individual police beats for any time in the past, helpful for a longer term understanding of neighborhood crime patterns.
Together, these two additions to the site make for a richer, more useful historical document and local watchdog tool. Please let us know what you think.
(cross-posted from the Crimespotting blog)
