Crimespotting
Our ground-breaking interactive map of arrests across San Francisco and Oakland showed the promise of visualizations of public data.
Background
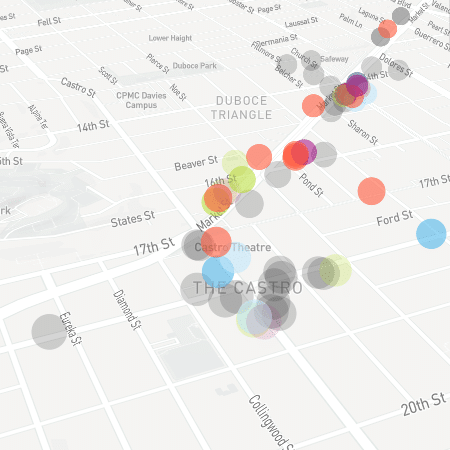
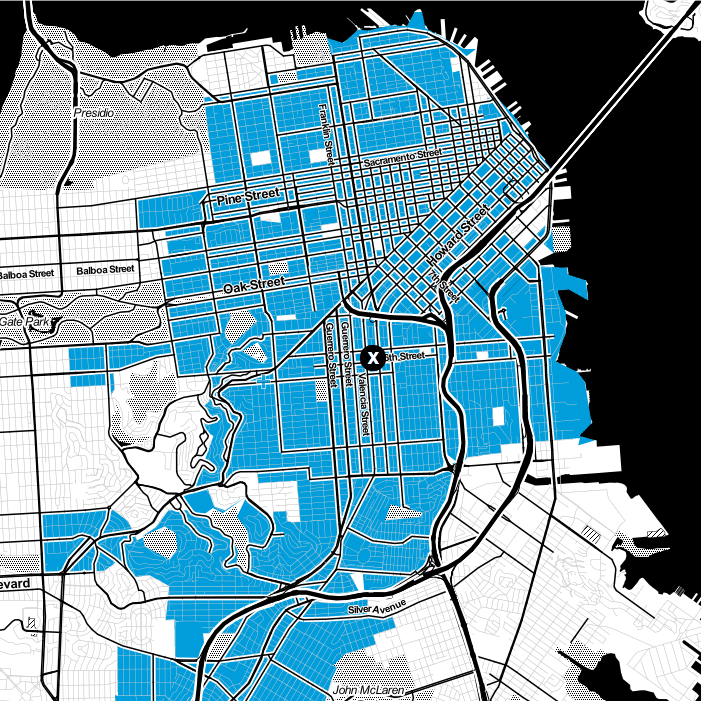
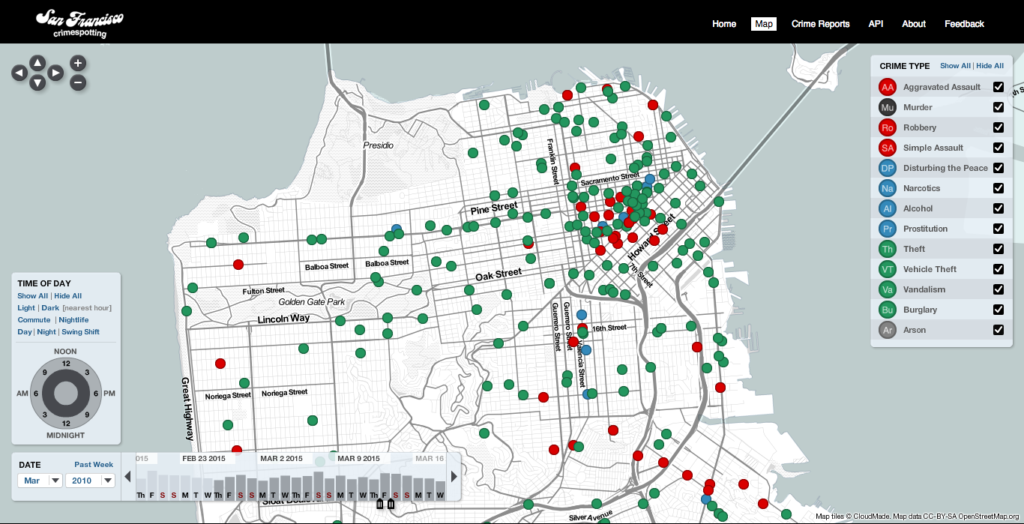
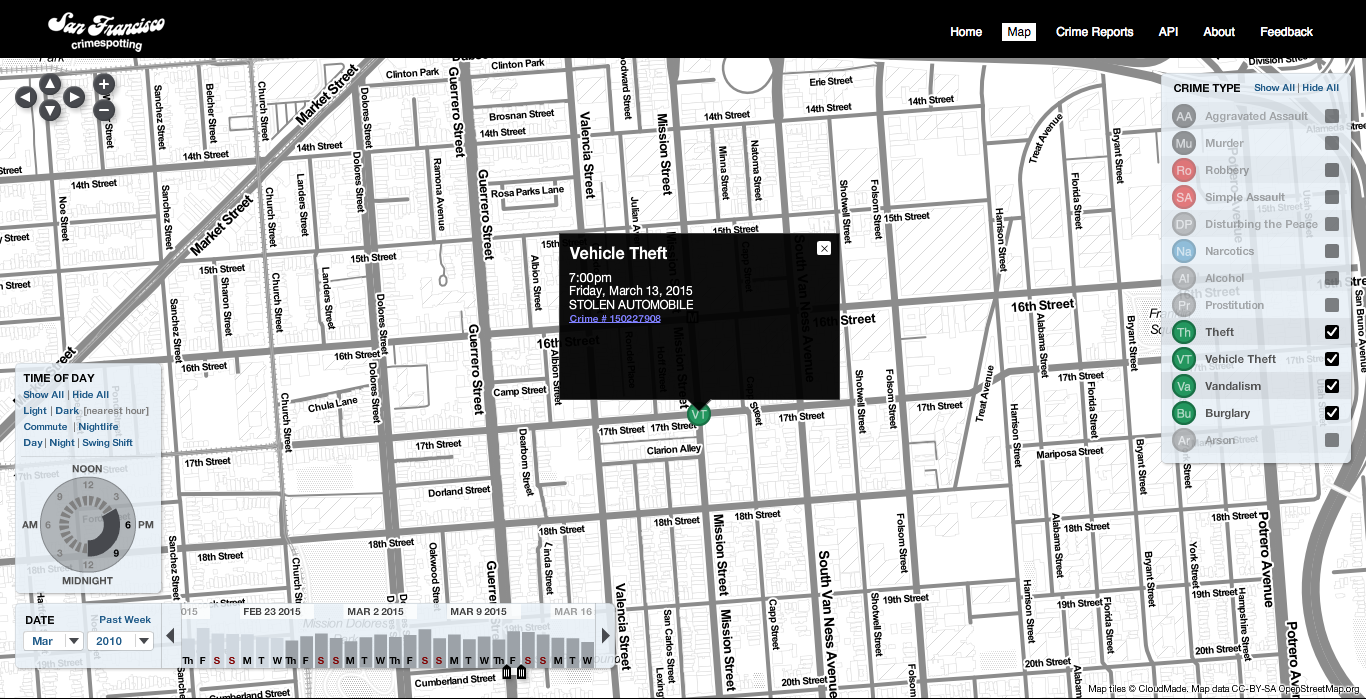
If you hear sirens in your neighborhood, you should know why. One of the first fully web-native visualizations of urban crime data in the world, Crimespotting made this possible in San Francisco and Oakland with interactive maps, e-mail updates, and RSS feeds of crimes in areas that you care about.
What we made
We believe that civic data should be exposed to the public in a more open way. With these maps, Stamen helped to start a movement to inspire local governments to use this data visualization model for the public release of many different kinds of data: tree plantings, new schools, applications for liquor licenses, and any other information that matters to people who live in neighborhoods. We welcome inquiries from municipalities and other interested parties who seek to provide their data to the public in a more transparent and sharable manner.
There’s nothing cool about crime, but Stamen Design comes pretty damn close to making it cool with the new site it built and designed, San Francisco Crimespotting. MG Siegler TechCrunch

