This post was originally published on stamen.com by Michal Migurski.
This is a follow up post to yesterday’s post about watercolor textures, Tuesday’s about watercolor process, and Monday’s announcing the launch of maps.stamen.com.
Terrain Layer has been on my mind since 2008 when I first started to experiment with digital elevation data, but it’s only really come together in the past year when Nelson Minar and I started kicking ideas around for making an open source answer to Google’s terrain layer. As an amateur pilot and an iPad owner, Nelson was interested in something that would make sense seen from high above. I was interested in something that would make sense at medium zooms, with all the crazy data-munging that implies.
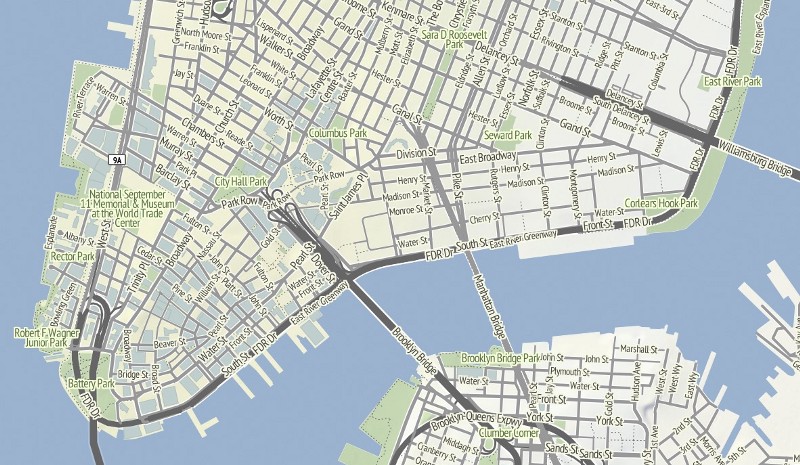
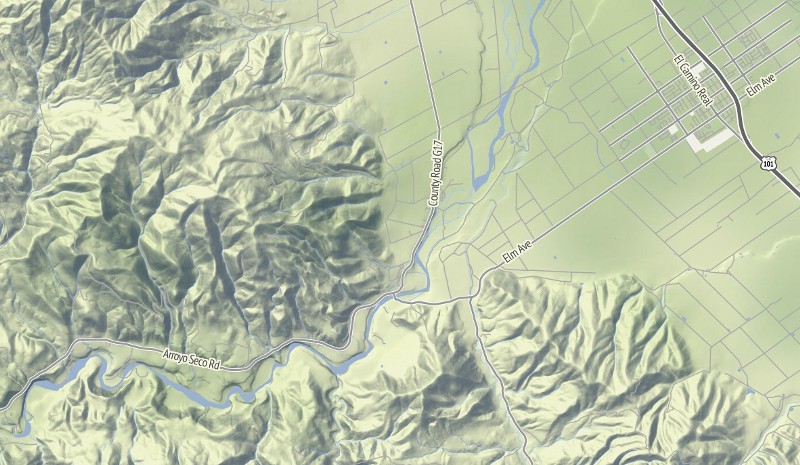
An image as simple as this, for example, requires so much more than plain OpenStreetMap data can provide:
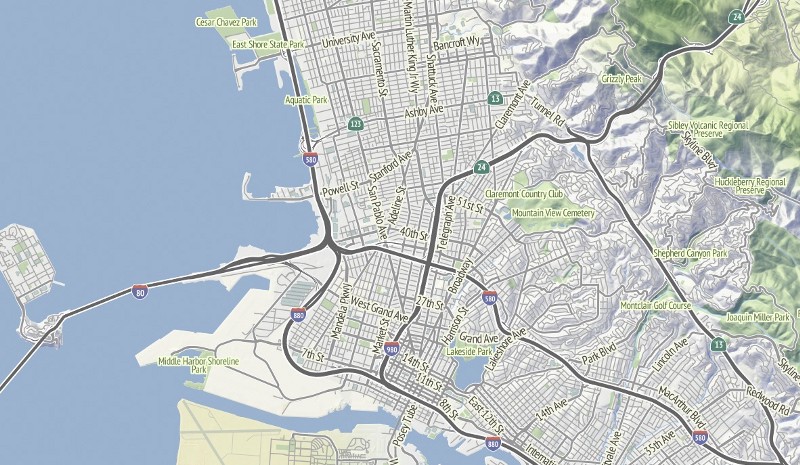
Obviously, there are the hills. The streets present a problem, too: many large roads that you might see at this scale are modeled as “dual carriageways” in OSM, which means that they’re actually two one-way roads as far at the database is concerned, so you can end up with a lot of doubled-up street names. The route numbers are often hidden away in weird tags with extra junk attached, and even picking the right color for the ground is a challenge.
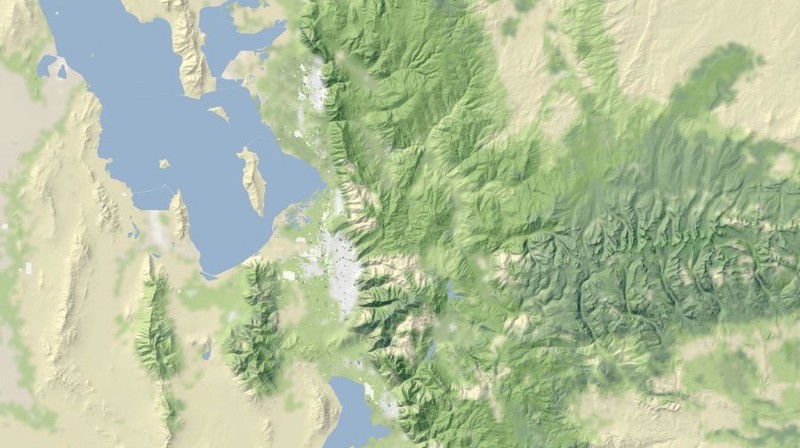
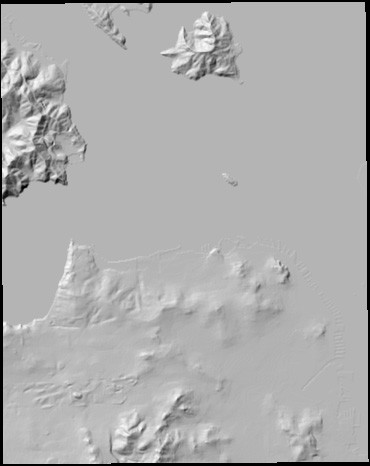
Happily, the U.S. Geological Survey has our back. They publish absolute mountains (heh) of fascinating and useful data, including high resolution elevation models of the entire country that can be transformed into shaded hills, and types of land cover that can be colored according to vegetation.
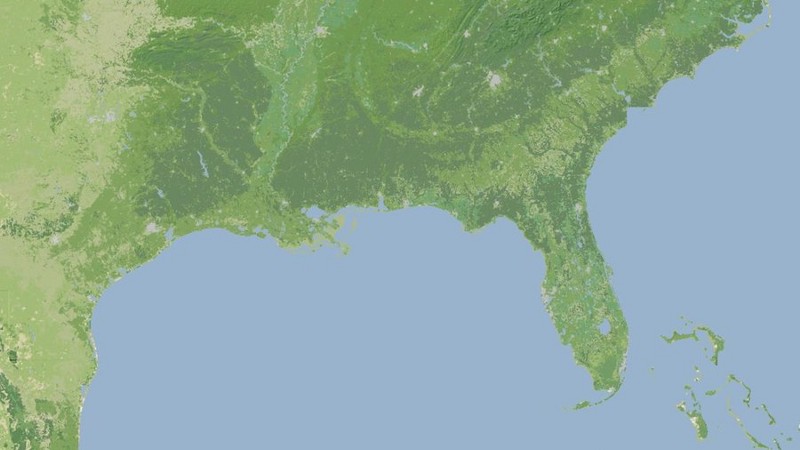
Gem Spear helped me develop a custom color palette for the landcover, explaining the meaning of different plant classes, five kinds of forest, combinations of shrubs, grasses and crops, and a few tundras and wetlands and how they should appear together on a map.
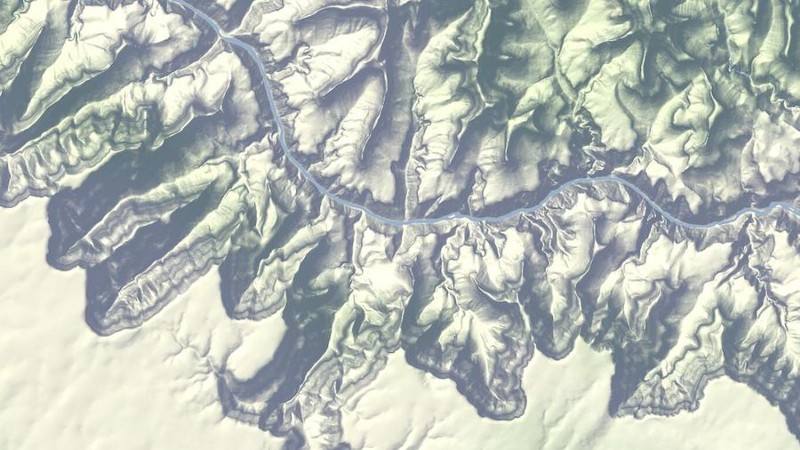
The ground and hill renderings are about imitating the work of Eduard Imhof, whose use of color derived from grayscale relief simulated the appearance of hills in sunlight. My version is drastically toned-down from his, but the hint of warm and cool are there:
Back in the foreground, we’re making three adjustments to the base OSM data to improve the look of these maps.
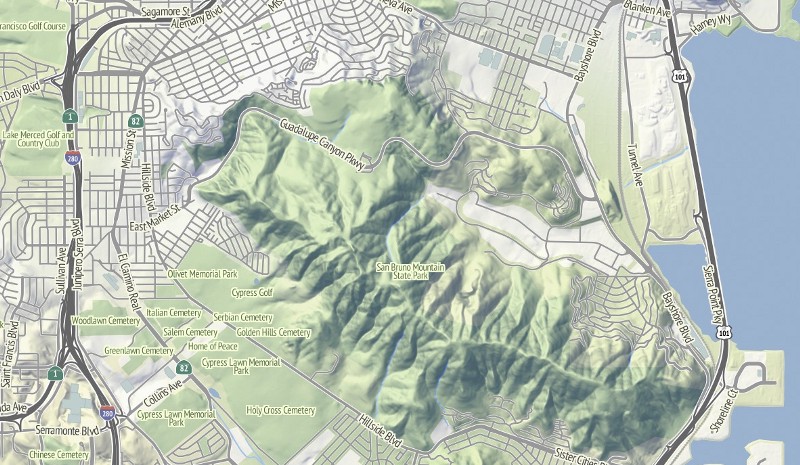
First, High Road is a framework for normalizing the rendering of highways from OSM data, a critical piece of every OSM-based road map we’ve ever designed at Stamen. Deciding exactly which kinds of roads appear at each zoom level can really be done just once, and ideally shouldn’t be part of a lengthy database query in your stylesheet. High Road sorts it all out, giving you good-looking road layering despite the zoom level.
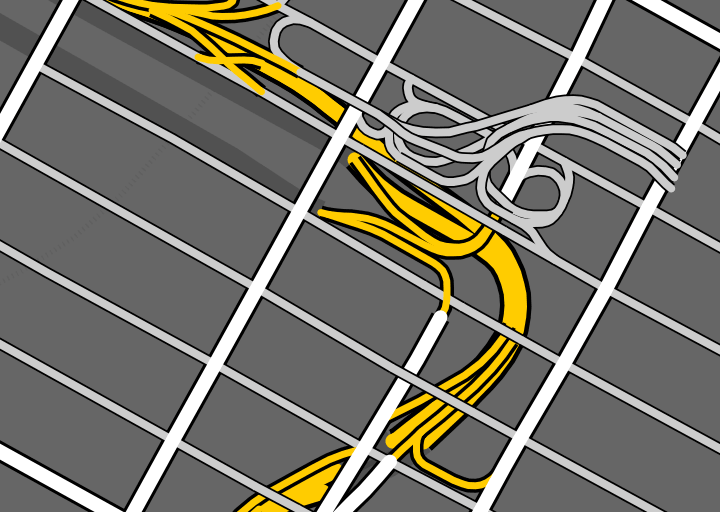
The shields and labels are both driven by some work I’ve been doing with Schuyler Erle on Skeletron. It’s an attempt to generalize complex linework in code using a range of techniques from the straight skeleton to Voronoi tesselation. I’m pre-processing every major road in the U.S. at a variety of zoom levels, so that big, complicated, doubled-up and messy roads are grouped together into neat lines that can be labeled using big, legible type:
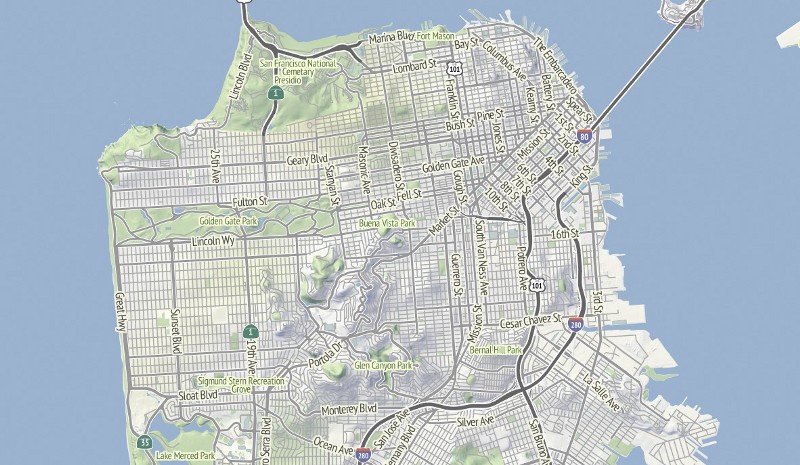
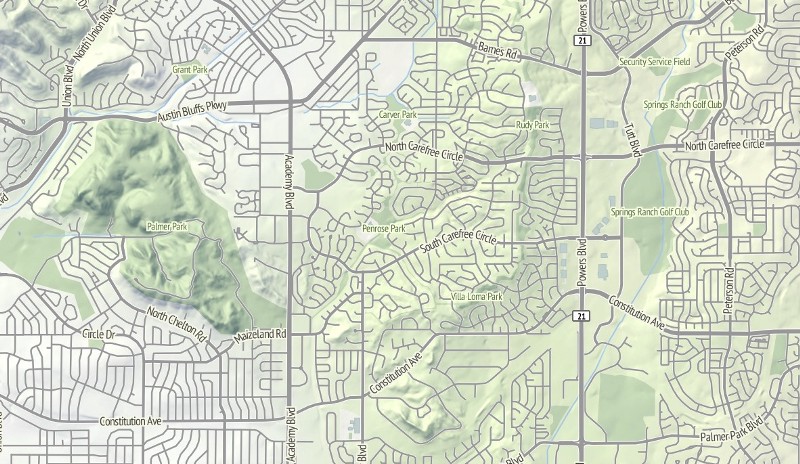
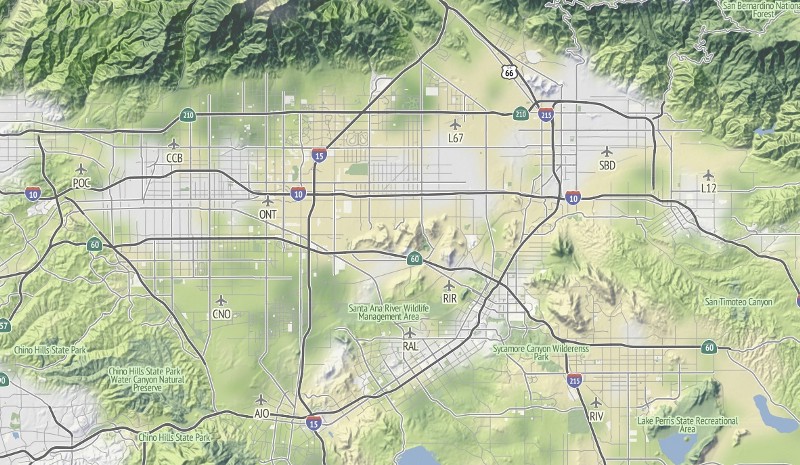
The highways are a special beast. I’m using a combination of Skeletron and route relations to add useful-looking highway shields for numbered freeways. One particular OpenStreetMap contributor, Nathan Edgars II, deserves special mention here. I feel as though every time I did any amount of research on correct representation or data for U.S. highways, NE2’s name would come up both in OSM and Wikipedia. He appears to be responsible for the majority of painstakingly organized highways on the map, which means that maps like this of the East L.A. freeway system can look more legible:
The final assembly takes place in TileStache’s Composite provider, inspired by Lars Ahlzen’s TopOSM to do exactly the kind of raster post-processing and compositing that makes this terrain map possible. Everything we’re using is 100% open and available via Github.
I’ll close with some images of my favorite spots: